Bubble Chart
Creating a spreadsheet file with bubble chart using UniOffice will be demonstrated in this guide.
Before you begin
You should get your API key from your UniCloud account.
If this is your first time using UniOffice SDK, follow this guide to set up a local development environment.
Clone the project repository
In your terminal, clone the examples repository. It contains the Go code we will be using for this guide.
git clone https://github.com/unidoc/unioffice-examples
To get the example navigate to the path spreadsheet/bubble-chart folder in the unioffice-examples directory.
cd unioffice-examples/spreadsheet/bubble-chart/
How it works
The import section in lines 4-11, imports the necessary UniOffice packages and other Go libraries.
The init function in lines 13-20, sets the metered license API key using license.SetMeteredKey(os.Getenv(`UNIDOC_LICENSE_API_KEY`)).
The main function starts in line 22. In this function in line 23, a new spreadsheet.Workbook using spreadsheet.New(). Then, a new spreadsheet.Sheet is added using ss.AddSheet(). Lines 28-41 creates the data by first creating the header row then the rest of the rows are drawn using a for loop.
In lines 42-44, new spreadsheet.Drawing and chart.Chart are created. A new bubble chart is created in line 46.
Line 48-52, creates a new chart.BubbleChartSeries and sets its properties. Then the charts is set with two axes in lines 55-58 using:
ca := chart.AddCategoryAxis()
va := chart.AddValueAxis()
lc.AddAxis(ca)
lc.AddAxis(va)

ca.SetCrosses(va)
va.SetCrosses(ca)
The drawing is set by calling SetDrawing method of the preadsheet.Sheet object.
Finally, the file is validated and saved in the final portion of the code using:
if err := ss.Validate(); err != nil {
  log.Fatalf("error validating sheet: %s", err)
}
ss.SaveToFile("bubble-chart.xlsx")
Run the code
Run the following command to create the spreadsheet file.
go run main.go
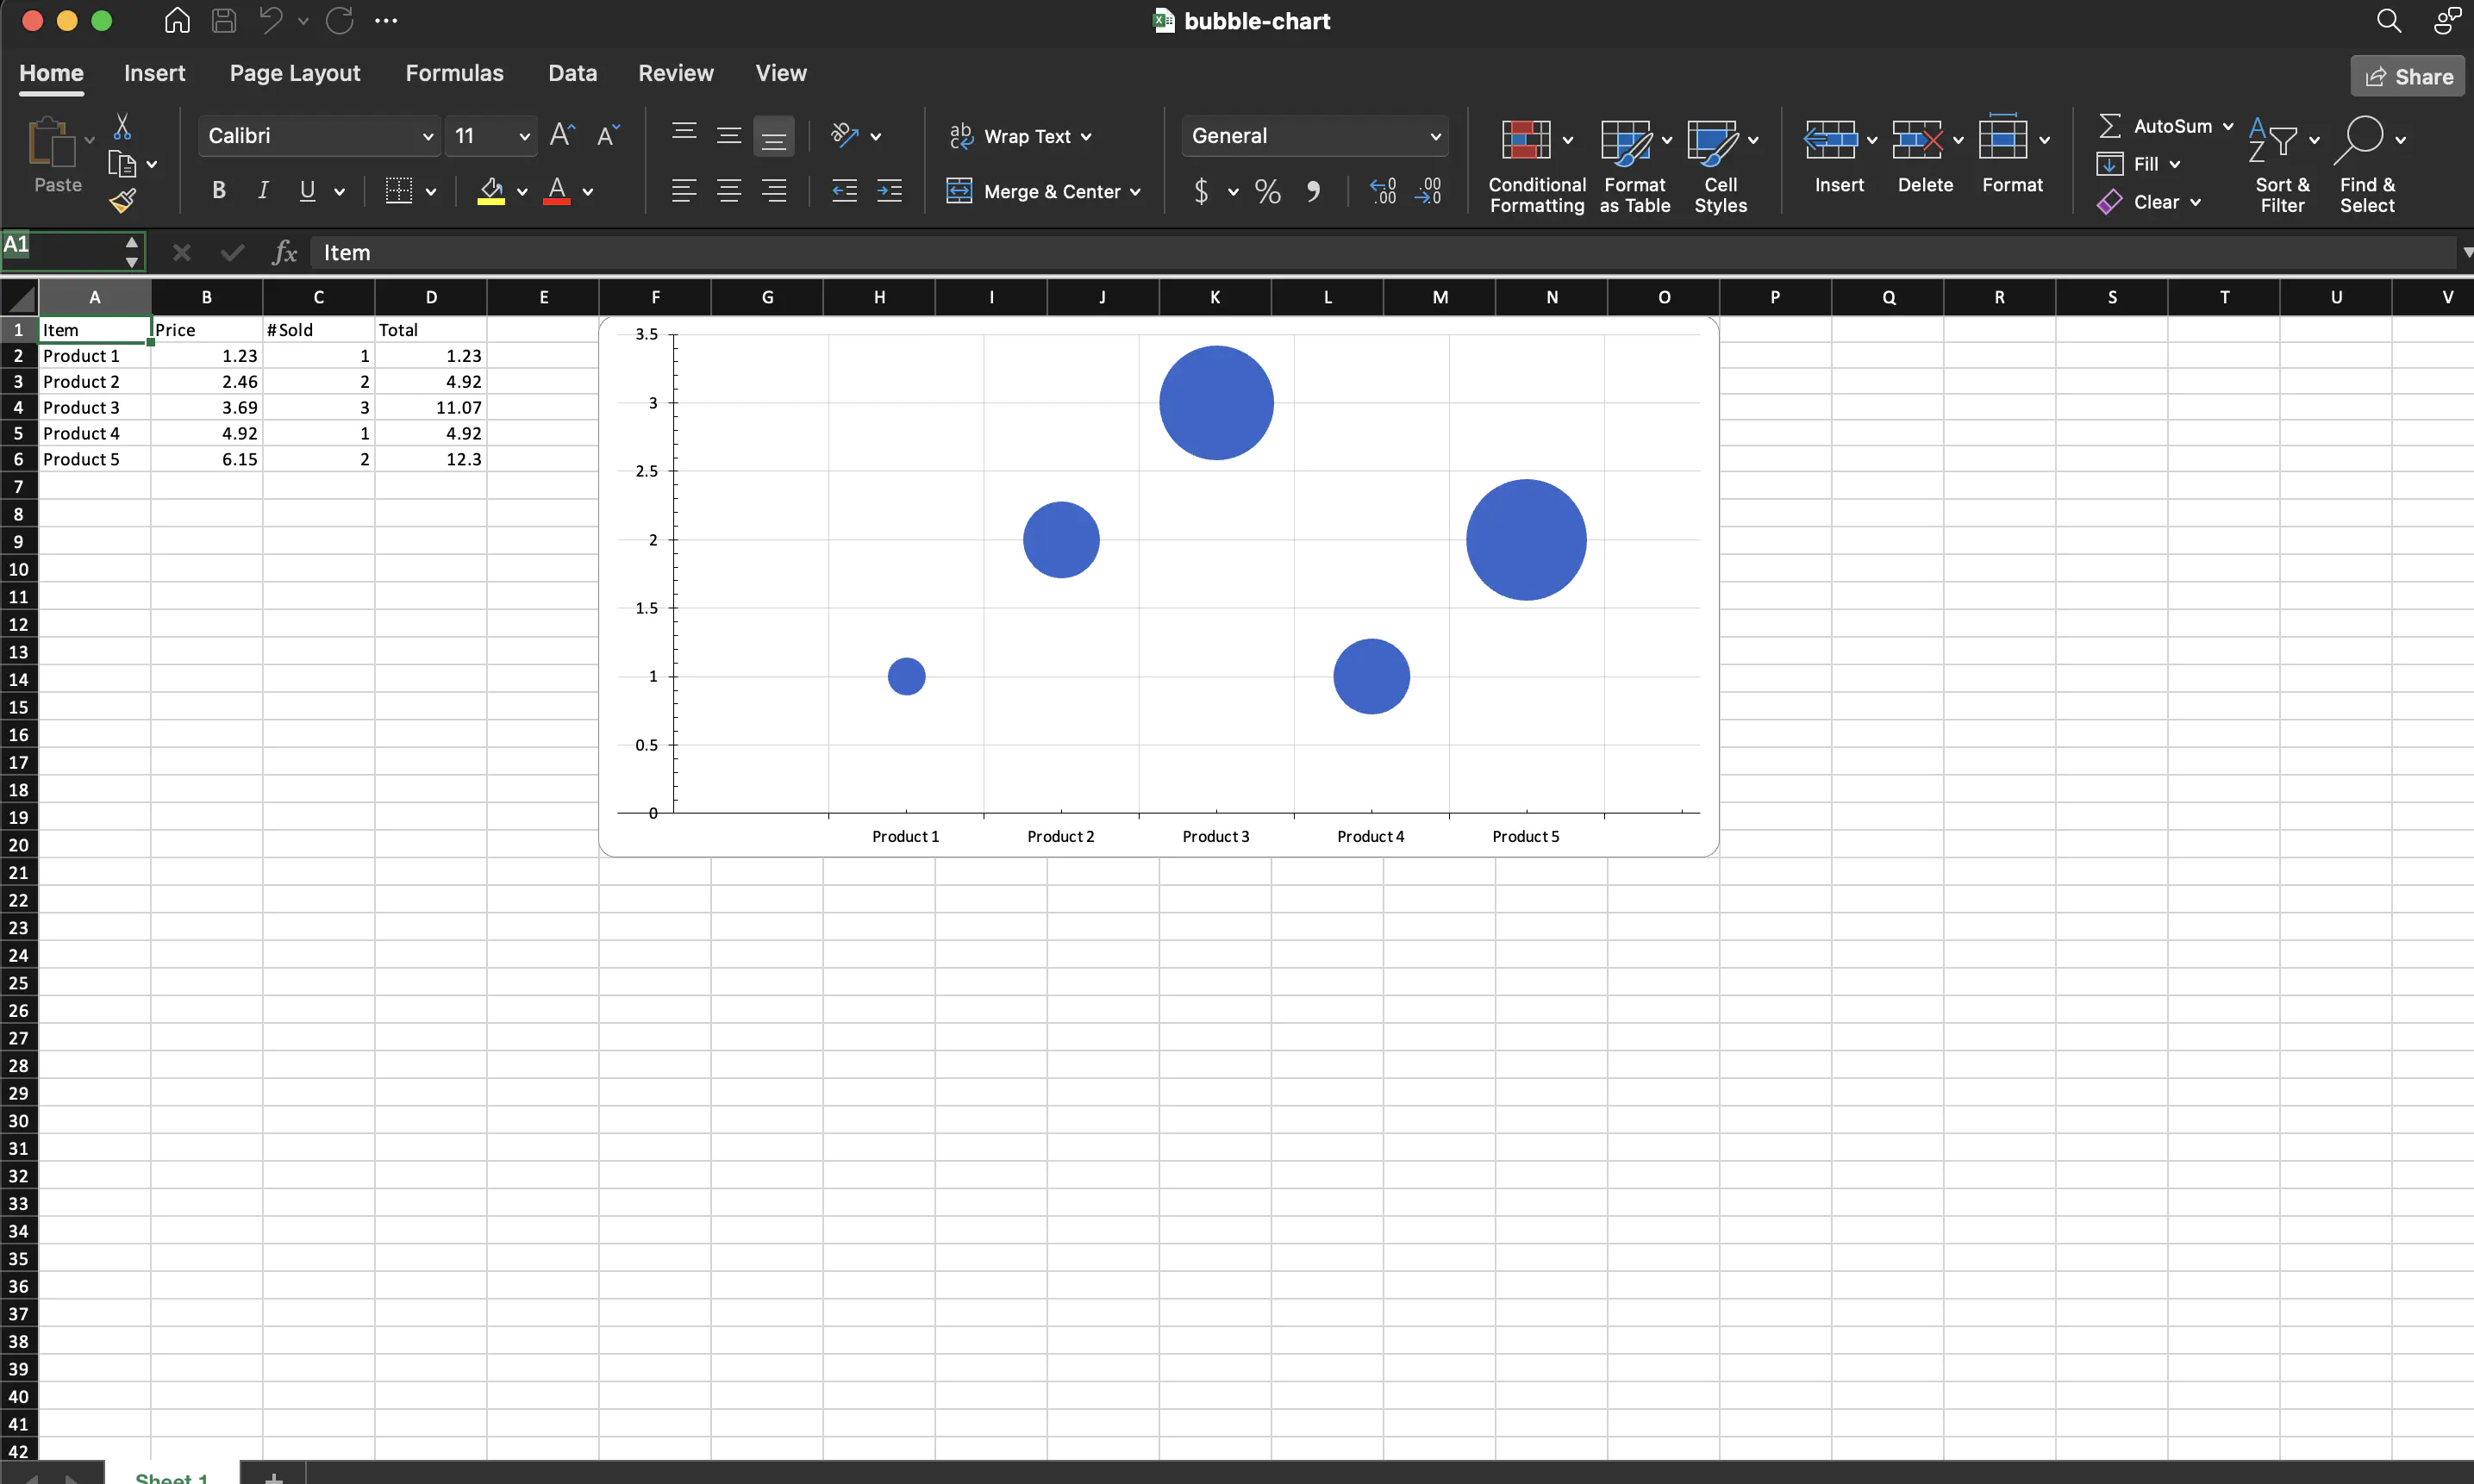
Sample output
Spreadsheet file.