Creating Pie Chart
This guide will explain the process of creating a pie chart using UniOffice.
Before you begin
You should get your API key from your UniCloud account.
If this is your first time using UniOffice SDK, follow this guide to set up a local development environment.
Clone the project repository
In your terminal, clone the examples repository. It contains the Go code we will be using for this guide.
git clone https://github.com/unidoc/unioffice-examples
To get the example navigate to the path spreadsheet/pie-chart folder in the unioffice-examples directory.
cd unioffice-examples/spreadsheet/pie-chart/
How it works
The import section in lines 4-11, imports the necessary libraries.
The init function defined in lines 13-20, initializes the package by setting the metered license key.
The main function is defined in lines 22-66. In lines 23-25 of this function, a new workbook with an empty sheet is created. Then the header row of the table is created in lines 28-32. The for loop in lines 33-39 creates the rest of the rows.
A spreadsheet.Drawing is created to hold the chart in line 42 using ss.AddDrawing(). Then a new Chart is created in lines 43-44. Following this, a new PieChart is created using:
lc := chart.AddPieChart()
priceSeries := lc.AddSeries()
priceSeries.SetText("Price")
The category axis and the value axis are set in lines 50-53 and at the same time the label reference and value cells are set. Then in lines 55-57, the title and legend of the pie chart are set. The drawing is added to the spreadsheet.Sheet in line 60. Finally, the workbook is validated and saved to file using:
if err := ss.Validate(); err != nil {
	log.Fatalf("error validating sheet: %s", err)
}
ss.SaveToFile("pie-chart.xlsx")
Run the code
Use the following command to run the code.
go run main.go
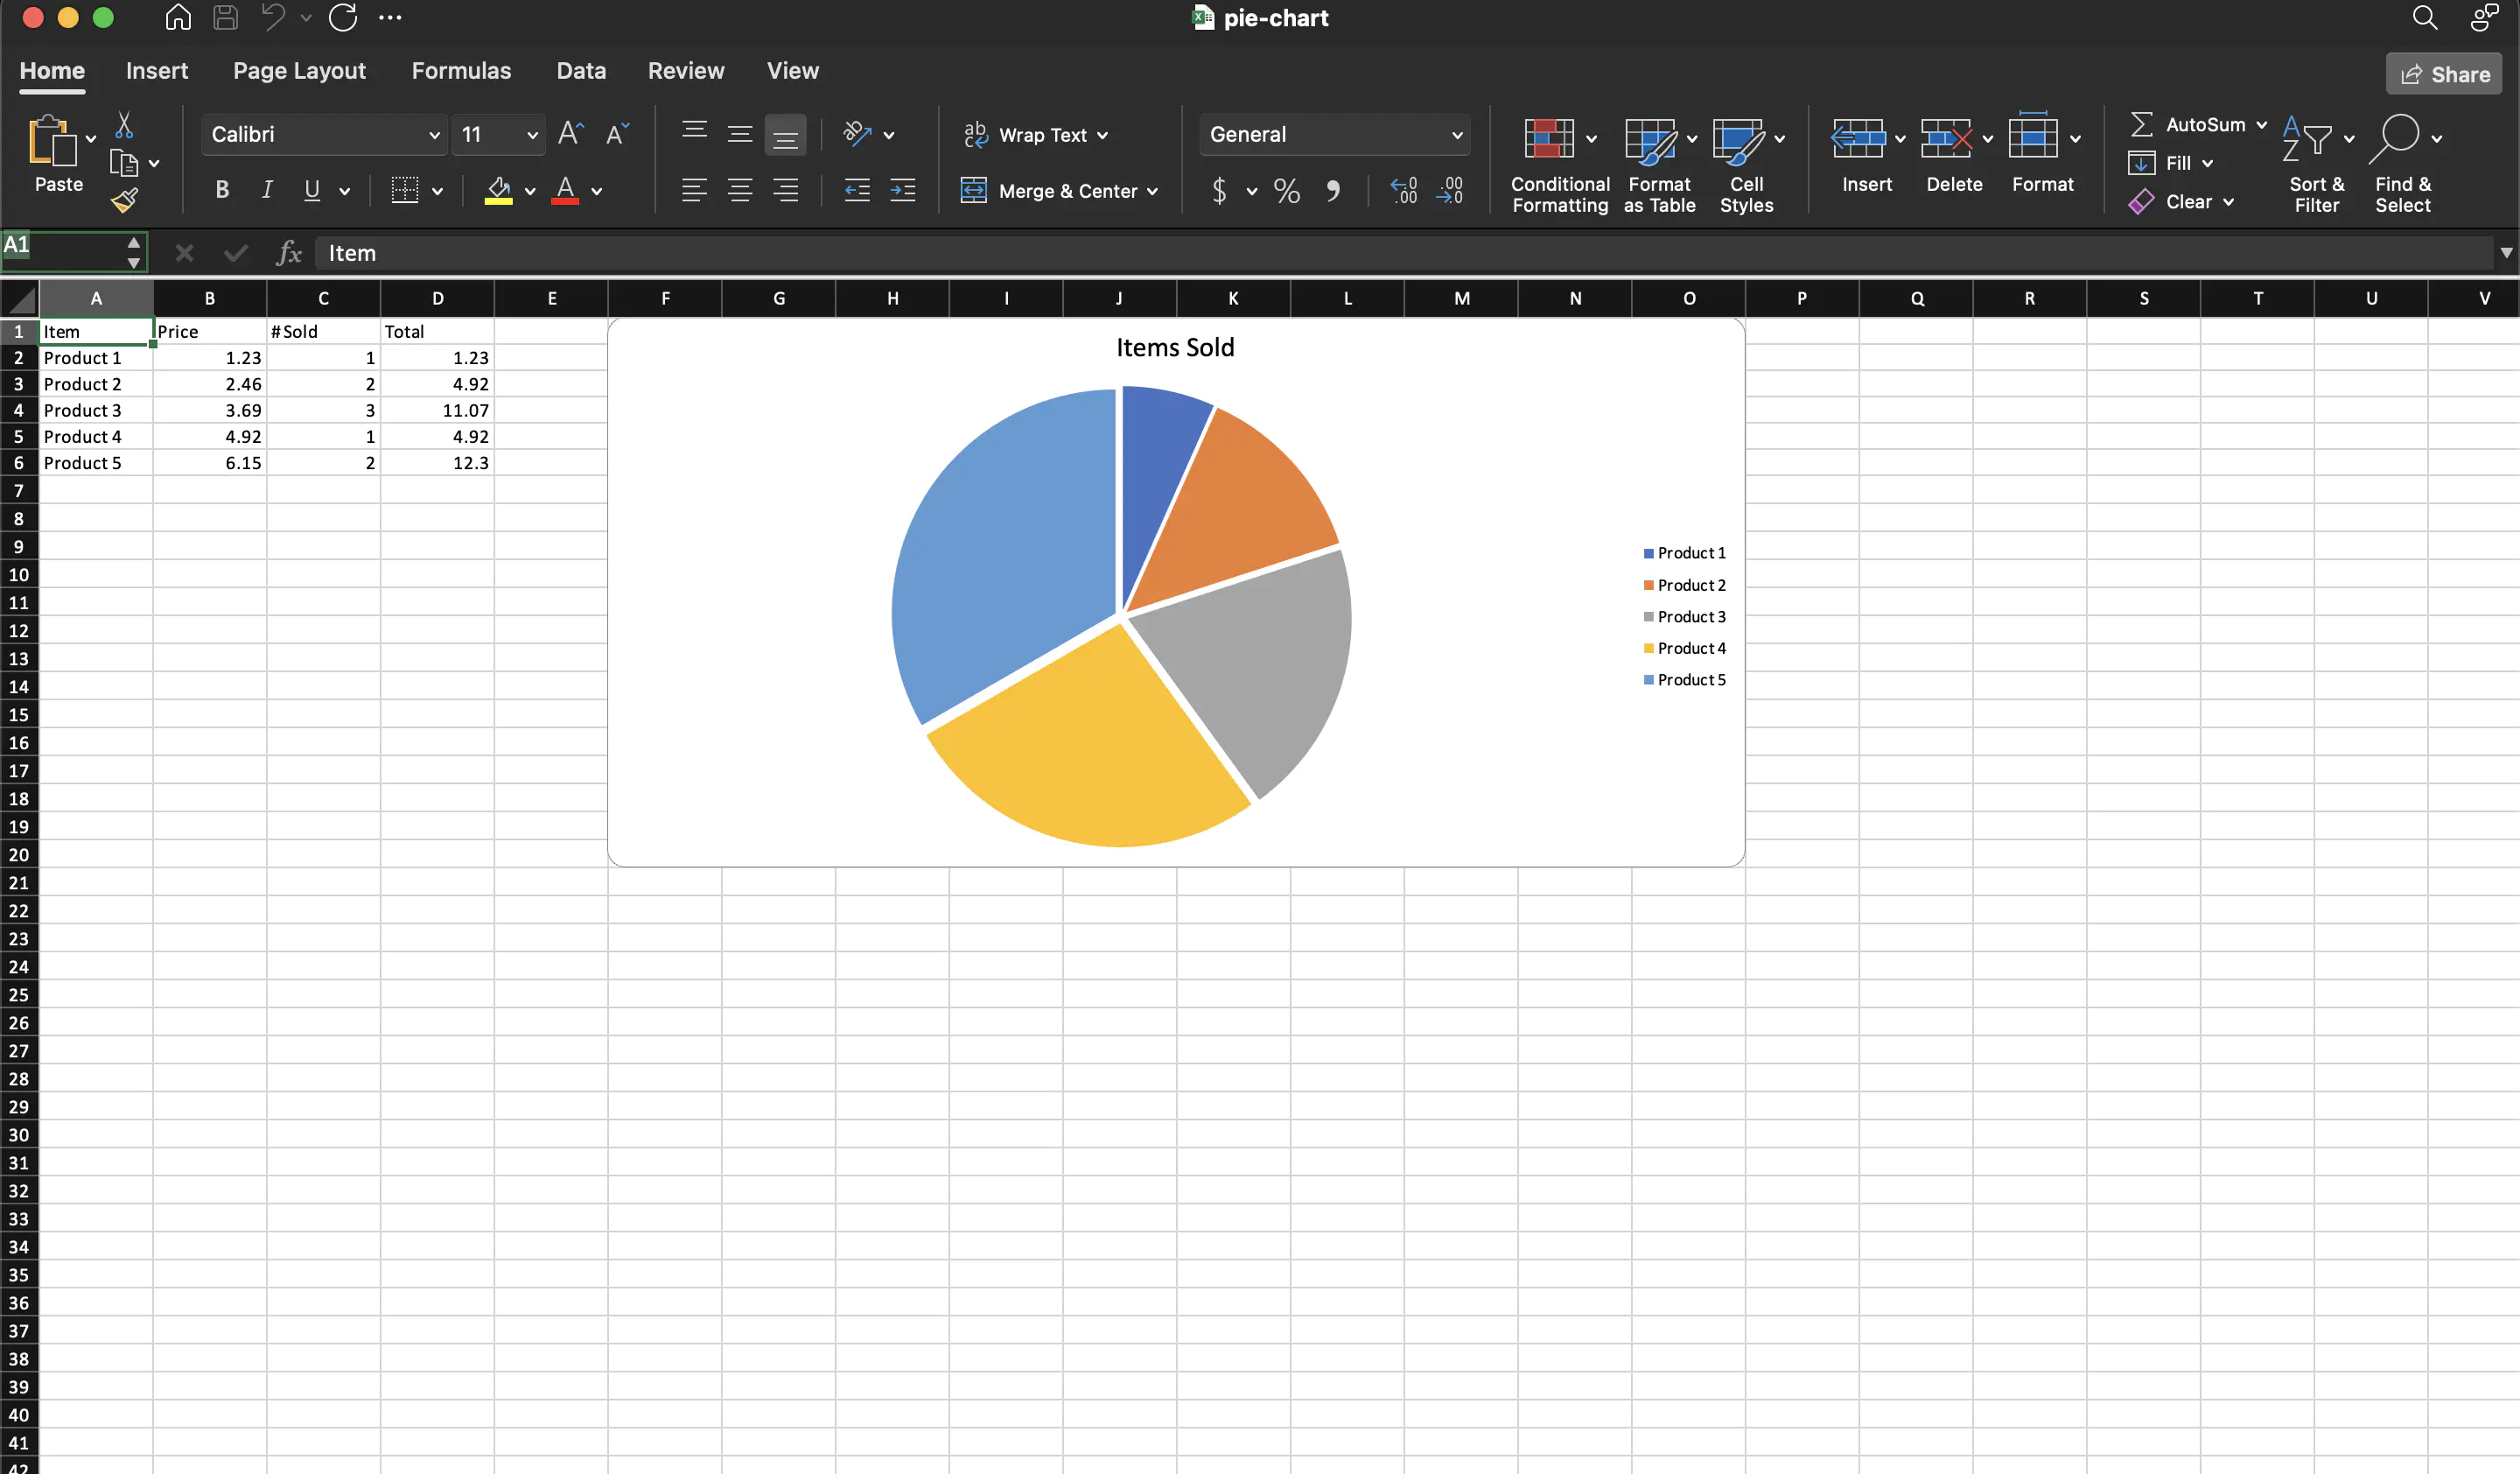
Sample Output