Creating Surface Chart
This guide will demonstrate the process of creating a surface chart using UniOffice.
Before you begin
You should get your API key from your UniCloud account.
If this is your first time using UniOffice SDK, follow this guide to set up a local development environment.
Clone the project repository
In your terminal, clone the examples repository. It contains the Go code we will be using for this guide.
git clone https://github.com/unidoc/unioffice-examples
To get the example navigate to the path spreadsheet/surface-chart folder in the unioffice-examples directory.
cd unioffice-examples/spreadsheet/surface-chart/
How it works
First the necessary libraries are imported from UniOffice and the Go standard library using the import section in lines 4-11.
Then the metered license key is set inside the init function defined in lines 13-20.
The surface chart is created in the main function defined in lines 22-85. New workbook with a new sheet is created in lines 23-25 using:
ss := spreadsheet.New()
defer ss.Close()
sheet := ss.AddSheet()
The defer call here just does some clean up tasks using the Close method of the workbook. This means closing the workbook and removing temporary files created.
The data are created in lines 28-39. After this, line 42 creates a new Drawing object to hold the charts to be created later. Then a new chart is created in line 43 using:
chart, anc := dwng.AddChart(spreadsheet.AnchorTypeTwoCell)
Using this chart a new surface chart is created by calling the AddSurfaceChart. A new series with a text price is created in lines 46-47. Then the label and value references of the series are set in lines 49-50. This is done using the following snippet.
priceSeries := lc.AddSeries()
priceSeries.SetText("Price")
// Set a category axis reference on the first series to pull the product names
priceSeries.CategoryAxis().SetLabelReference(`'Sheet 1'!A2:A6`)
priceSeries.Values().SetReference(`'Sheet 1'!B2:B6`)
Two more series, i.e. solid series and total series are created in the same way in lines 52-60.
The category axis, value axis, series axis of the chart are set in lines 62-71. This is followed by setting the title and legend in lines 74-76. Finally, the drawing that contains the chart is added to the sheet in line 79 using sheet.SetDrawing(dwng).
The validation of the workbook and saving it to file are done at the end of the main function, i.e, in lines 81-84.
Run the code
Run the code using the following command.
go run main.go
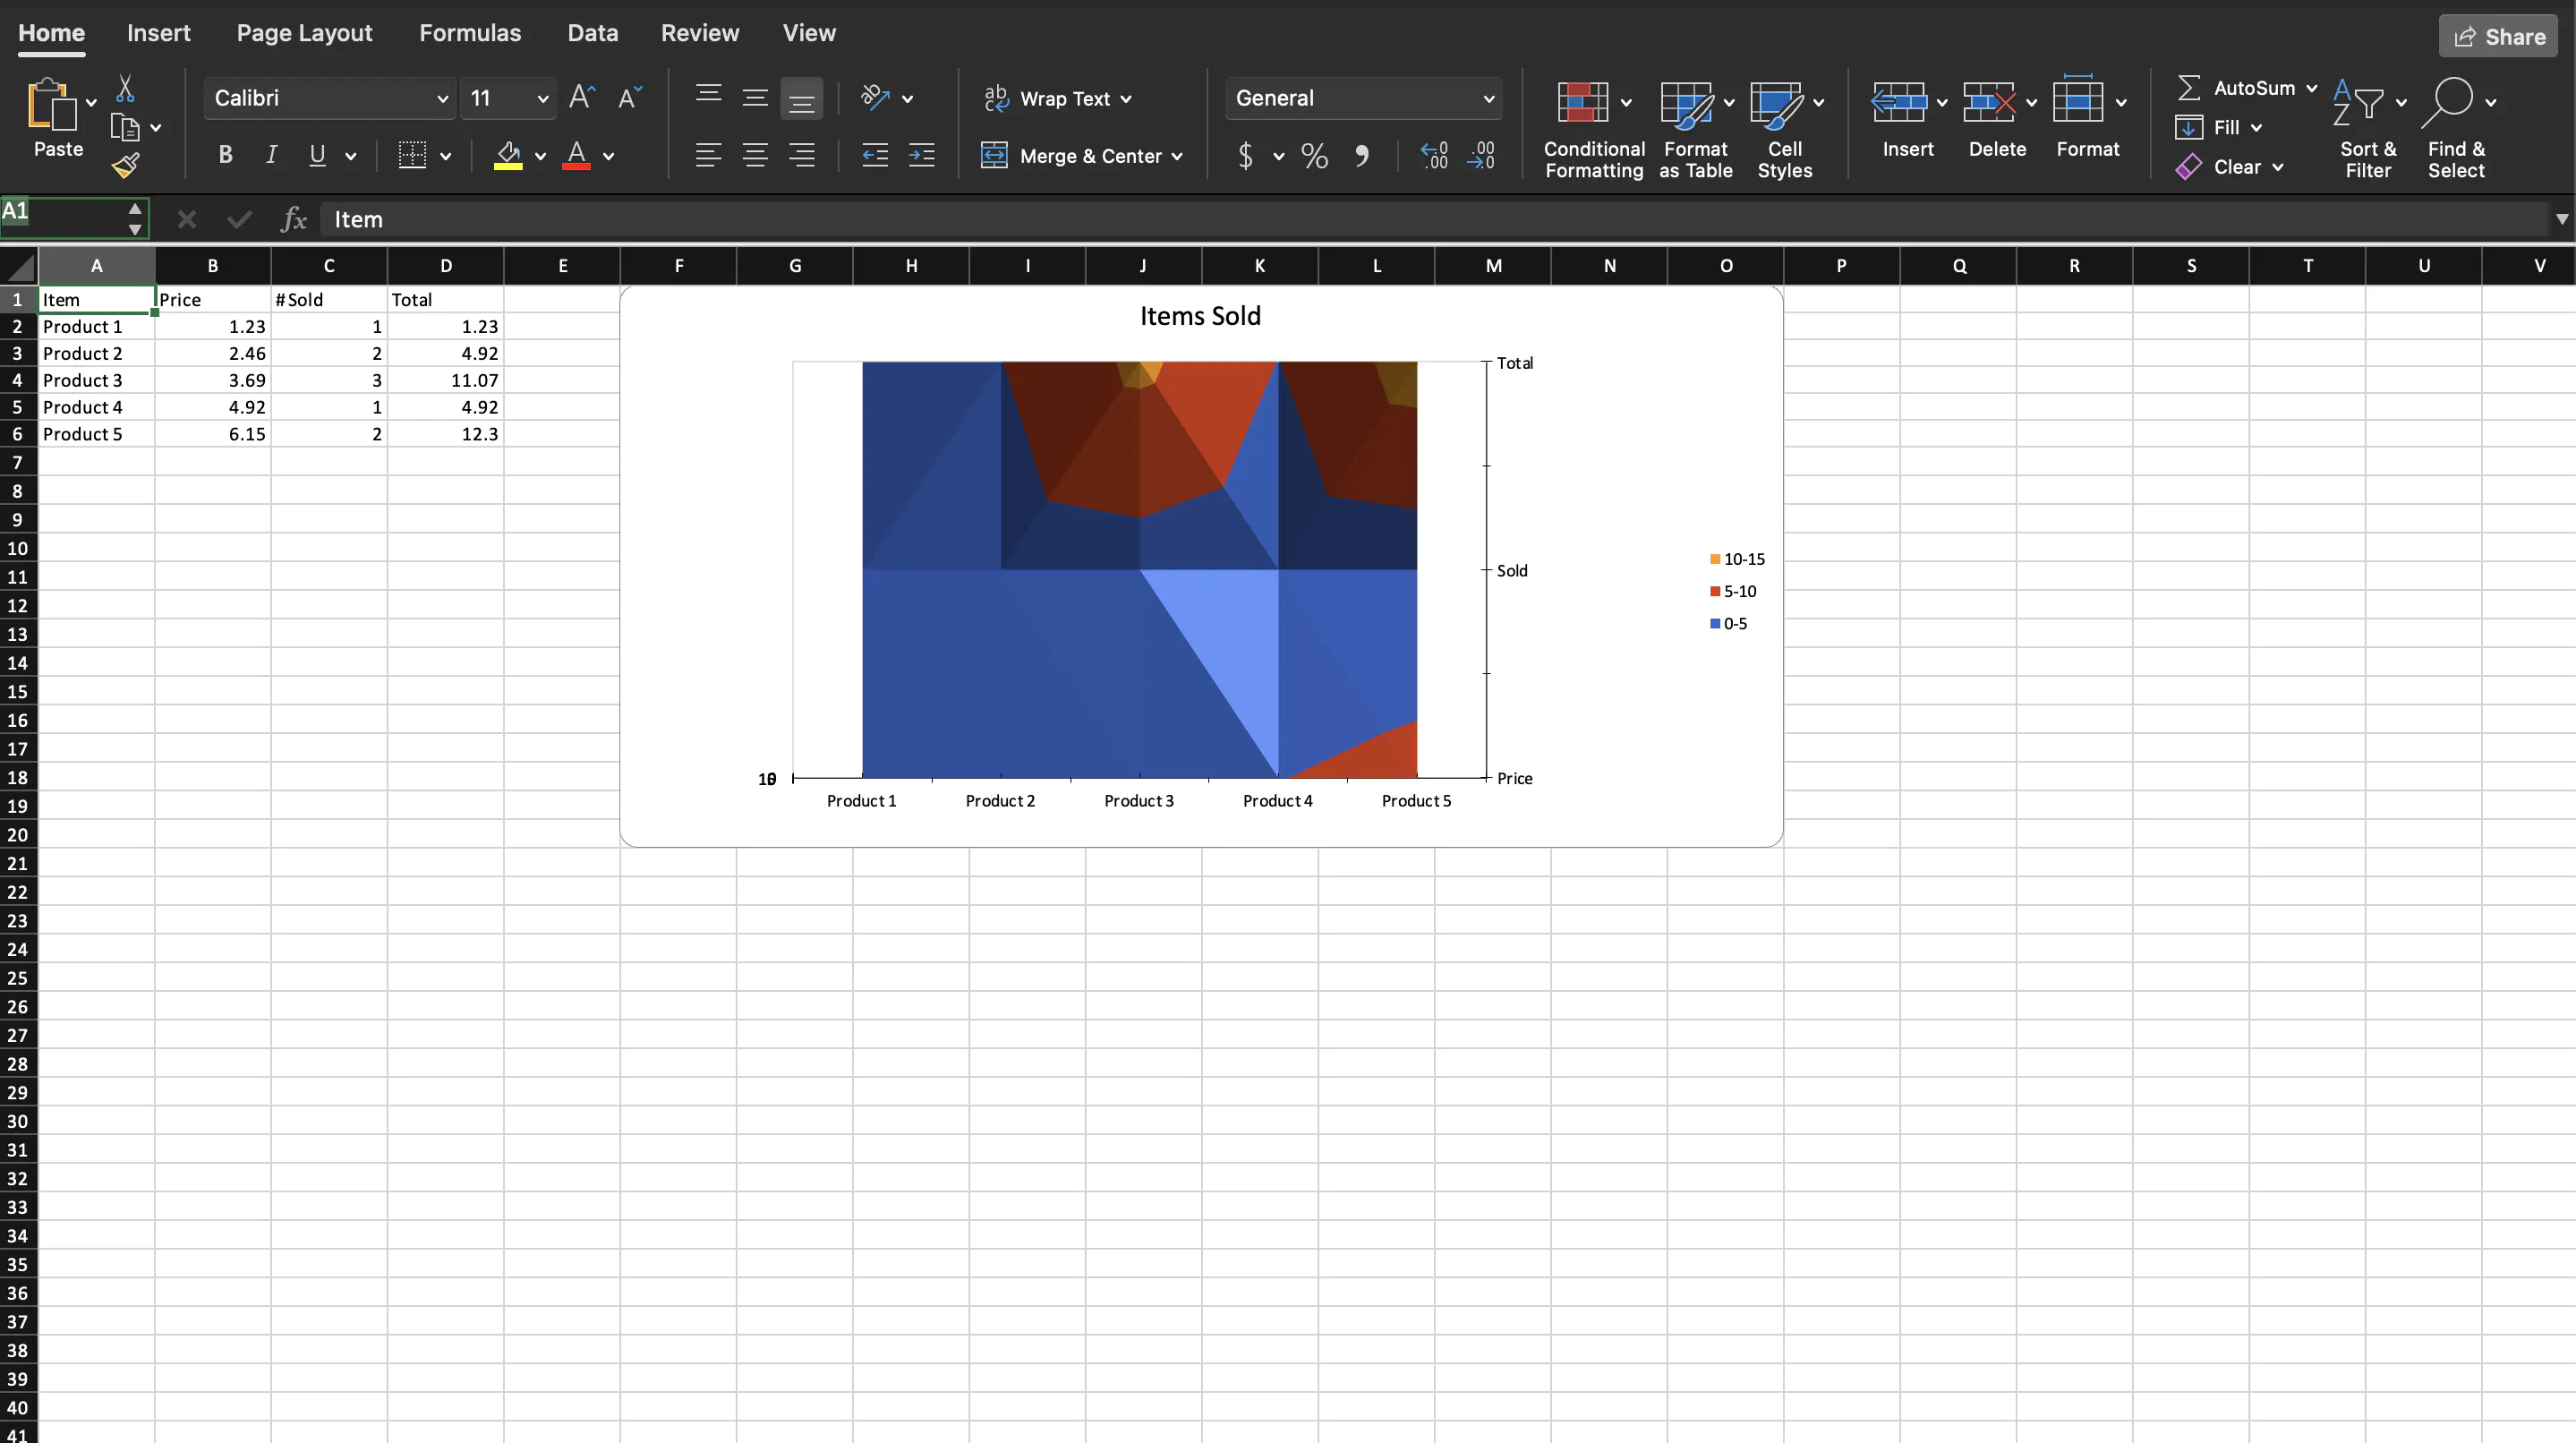
Sample Output