Insert 3D Line Chart
This guide will explain how to add 3D line chart inside spreadsheet workbook using UniOffice.
Before you begin
You should get your API key from your UniCloud account.
If this is your first time using UniOffice SDK, follow this guide to set up a local development environment.
Clone the project repository
In your terminal, clone the examples repository. It contains the Go code we will be using for this guide.
git clone https://github.com/unidoc/unioffice-examples
To get the example navigate to the path spreadsheet/line-chart-3d folder in the unioffice-examples directory.
cd unioffice-examples/spreadsheet/line-chart-3d/
How it works
The import section in lines 4-11, imports the necessary UniOffice and Go libraries.
Then the init function defined in lines 13-20, initializes the package by setting up the metered license key.
The main function is defined in lines 22-83. In line 23, The workbook is created using spreadsheet.New(). A new worksheet i.e. spreadsheet.Sheet is then added to this workbook using ss.AddSheet() in line 25. In the next section, i.e. lines 28-32 the header row of the data table is created using:
row := sheet.AddRow()
row.AddCell().SetString("Item")
row.AddCell().SetString("Price")
row.AddCell().SetString("# Sold")
row.AddCell().SetString("Total")
This code snippet basically creates a new spreadsheet.Row object using AddRow method and then adds 4 cells to that row using AddCell method. The text content of the cells is then set at the same time by calling SetString method of the returned spreadsheet.Cell object.
The for loop in lines 33-39, adds 5 data rows to the table. The first column contains the product number data. The second column is populated with numeric data using SetNumber(1.23 * float64(r+1)). Here, r is 0 based row number. The third column is also populated with numeric data. Finally, the last is populated by a formula, which is the multiplication second and third columns.
Since charts are created inside drawings, a new drawing is created using AddDrawing method of the spreadsheet object. Then the chart is added to the drawing using dwng.AddChart(spreadsheet.AnchorTypeTwoCell).
A new chart.Line3DChart is added to the chart in line 46.
In line 47-48, a new chart.LineChartSeries with the text price is created. Then the label reference and the value references of the LineChartSeries are set in lines 50-51 using:
priceSeries.CategoryAxis().SetLabelReference(`'Sheet 1'!A2:A6`)
priceSeries.Values().SetReference(`'Sheet 1'!B2:B6`)
As can be seen in the above snippet, cells A2:A6 of sheet1 are set as the labels for the price series. Then the values are set to be cells B2-B6.
In lines 53-59, two more LineChartSeries are created in the same way.
Then the axes, i.e, category axis, value axis and series axis, are set in lines 62-72.
In lines 82-85, the workbook is validated and saved to file.
Run the code
To create the spreadsheet with 3d line chart, run the following command.
go run main.go
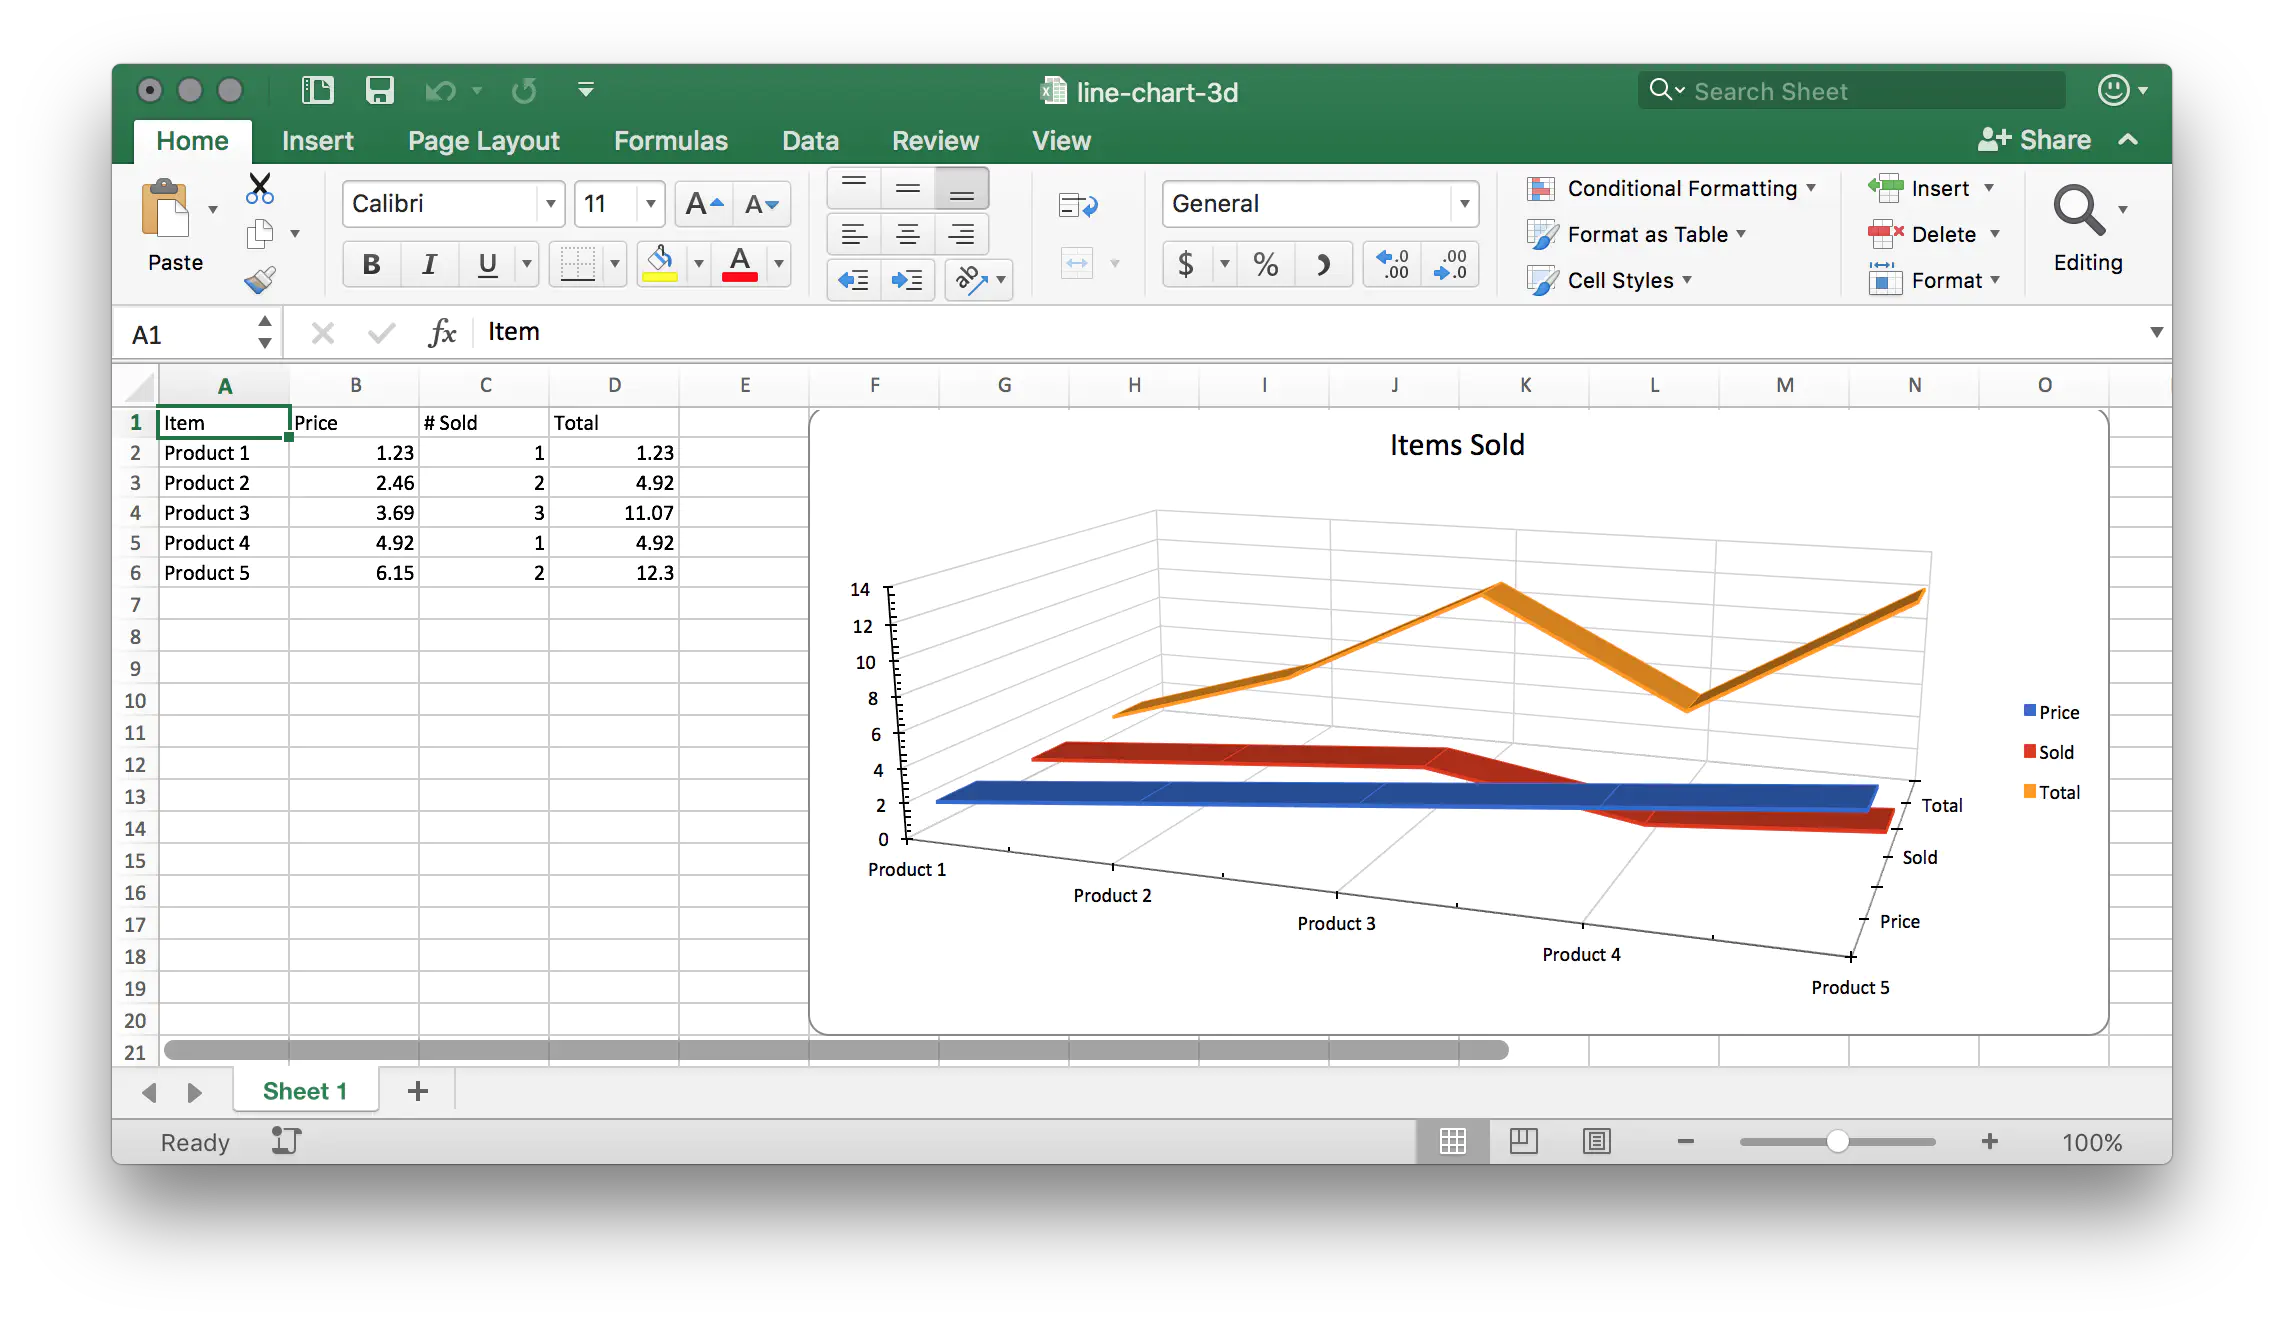
Sample Output