Insert Line Chart With No Data
This guide will explain the process of creating line chart without any data table.
Before you begin
You should get your API key from your UniCloud account.
If this is your first time using UniOffice SDK, follow this guide to set up a local development environment.
Clone the project repository
In your terminal, clone the examples repository. It contains the Go code we will be using for this guide.
git clone https://github.com/unidoc/unioffice-examples
To get the example navigate to the path spreadsheet/line-chart-no-data folder in the unioffice-examples directory.
cd unioffice-examples/spreadsheet/line-chart-no-data/
How it works
The code starts by importing the necessary libraries in lines 4-10. Then in lines 12-19, the metered license key is set in the init function using license.SetMeteredKey(os.Getenv(`UNIDOC_LICENSE_API_KEY`)). The License key is being loaded from the environment variable.
Then, the main function is defined in lines 21-67. In this function, a workbook with empty spreadsheet is created in lines 22-24. Then a new drawing is added to the spreadsheet.Sheet in line 26. After this a new chart is added to the drawing using dwng.AddChart(spreadsheet.AnchorTypeTwoCell) in line 27.
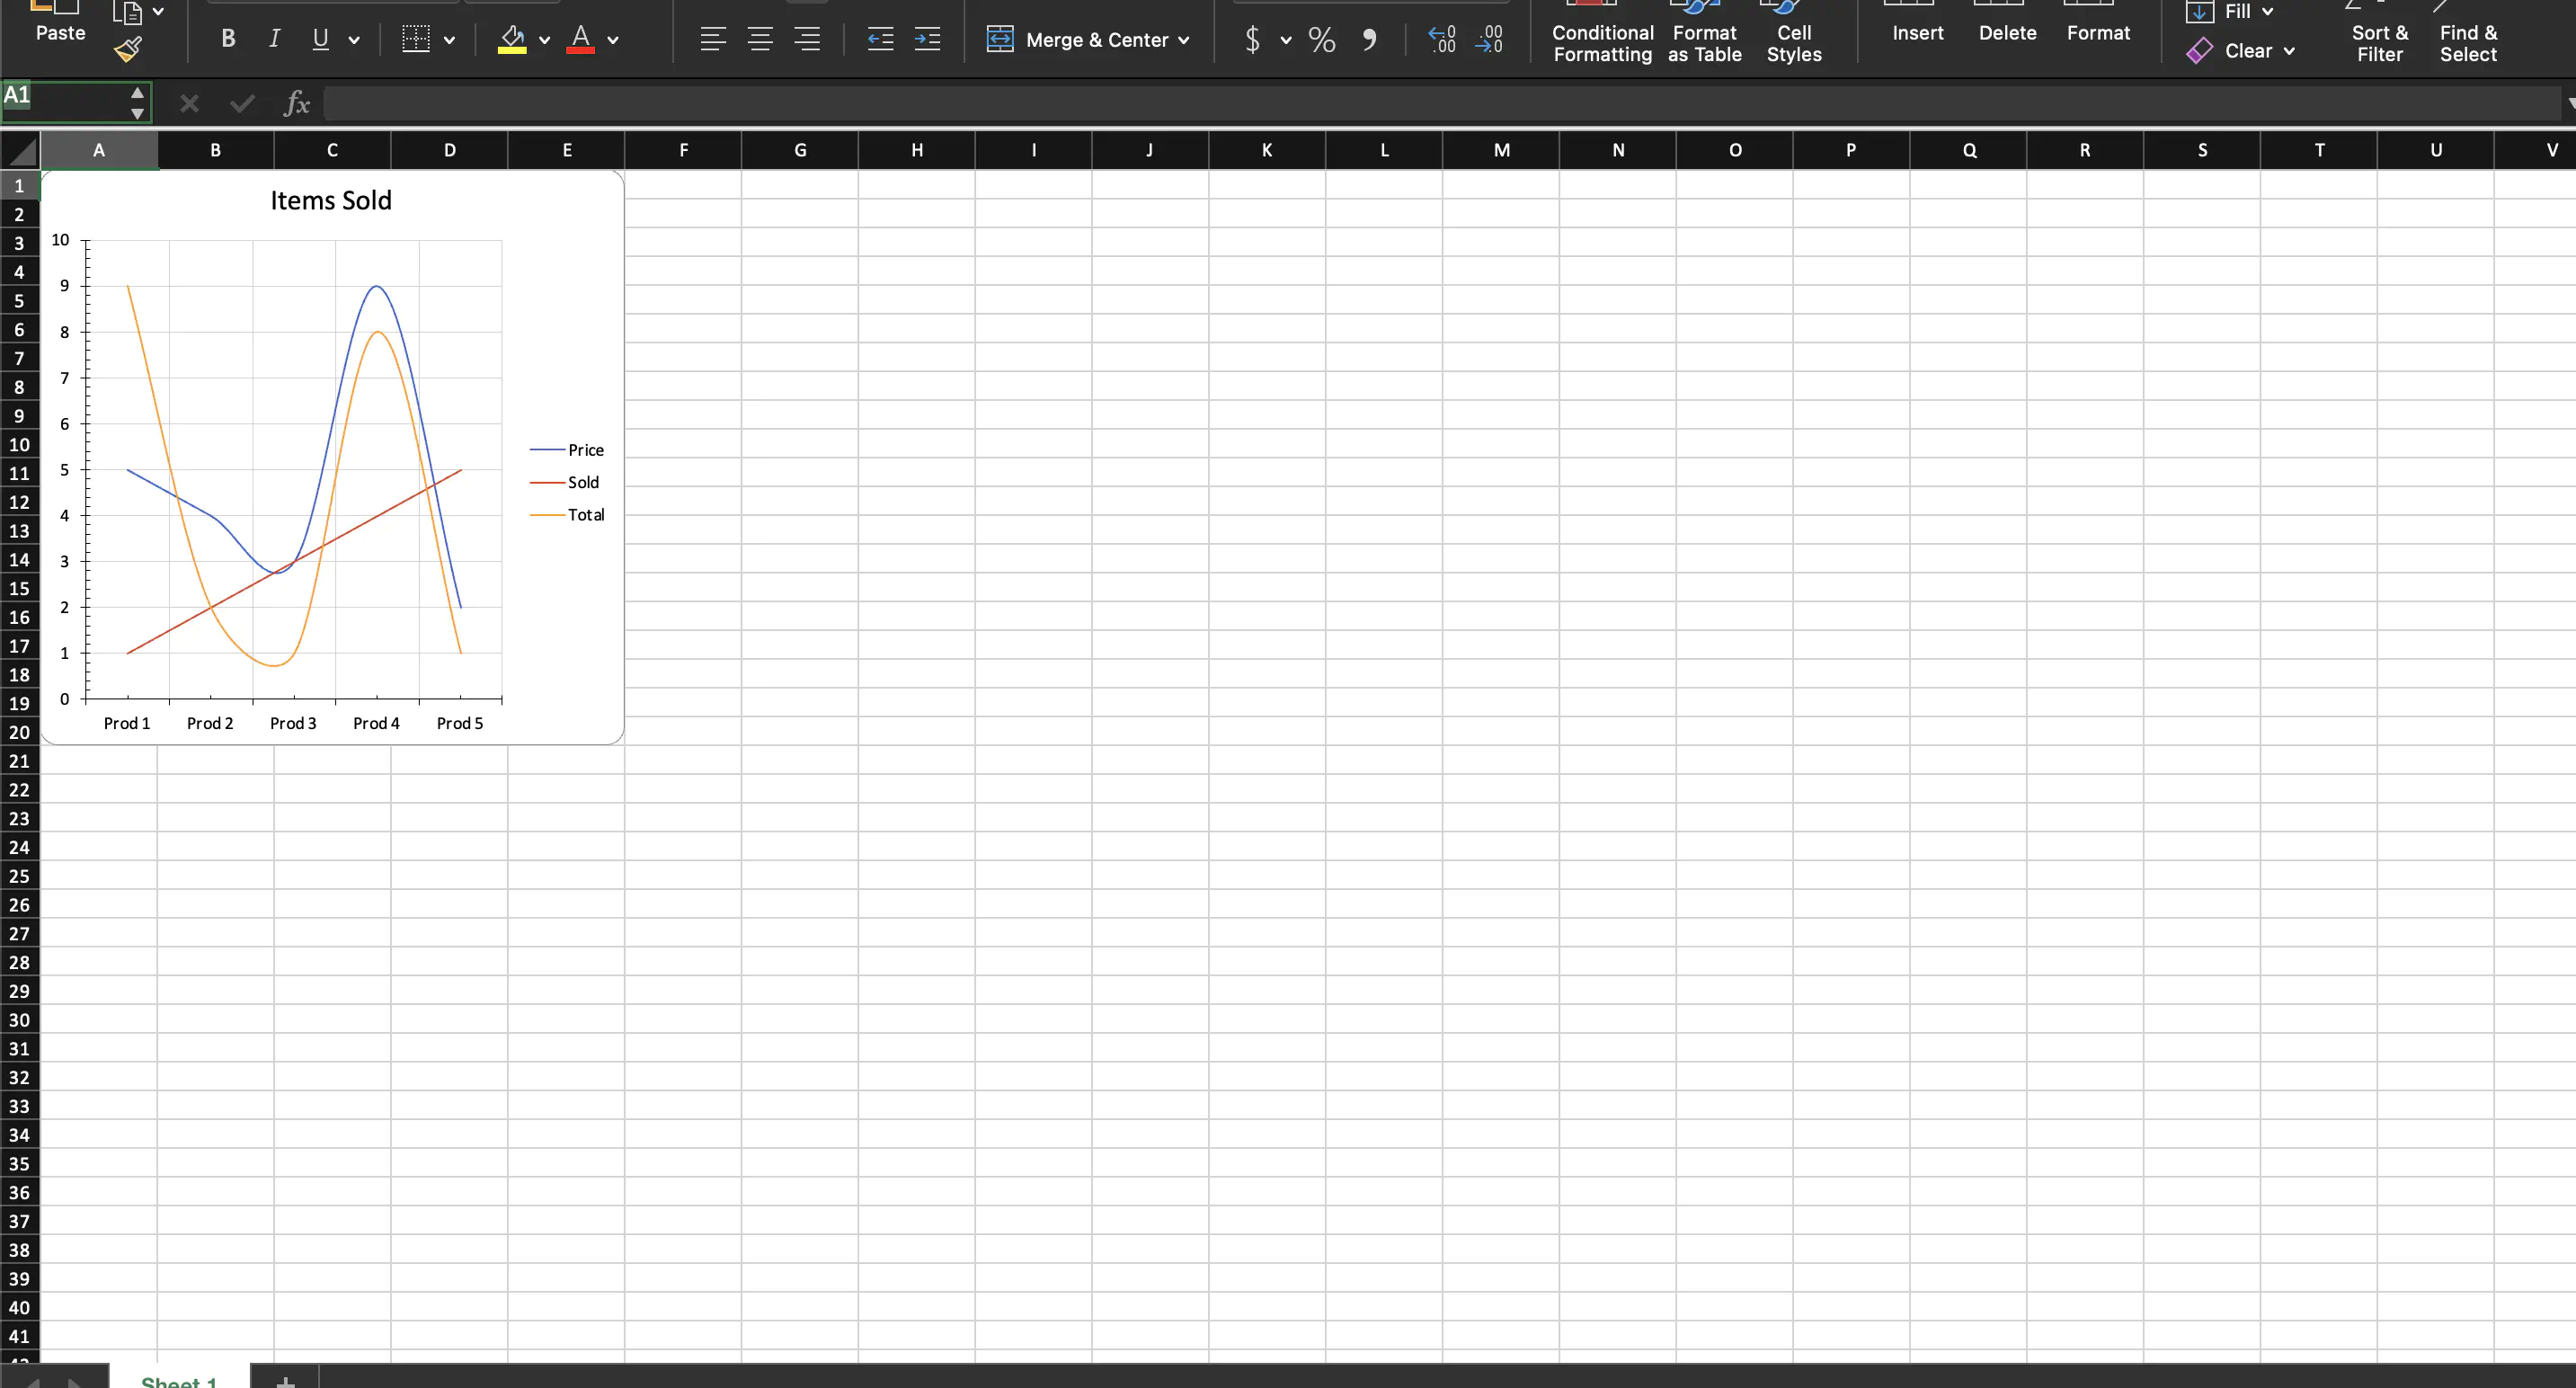
In line 32 a new line chart is created chart.AddLineChart(). After this, the necessary chart.LineChartSeries objects are created. Since there is no data, an array of numbers is set directly the values of the series. E.g. for price series, the labels and the data are set as follows.
priceSeries := lc.AddSeries()
priceSeries.SetText("Price")
priceSeries.CategoryAxis().SetValues([]string{"Prod 1", "Prod 2", "Prod 3", "Prod 4", "Prod 5"})
priceSeries.Values().SetValues([]float64{5, 4, 3, 9, 2})
As we can see from this example the value are hard coded. If there was a table, the values and labels would have been referenced by specifying the cell range.
The rest of the code, i.e. lines 47-61 is the same as the guide with data.
Finally, the workbook is validated and saved to file in lines 63-66.
Run the code
Use the following command to run the code.
go run main.go
Sample Output