Multiple Charts
This guide will explain the process of the creating multiple charts in Excel workbook using UniOffice.
Before you begin
You should get your API key from your UniCloud account.
If this is your first time using UniOffice SDK, follow this guide to set up a local development environment.
Clone the project repository
In your terminal, clone the examples repository. It contains the Go code we will be using for this guide.
git clone https://github.com/unidoc/unioffice-examples
To get the example navigate to the path spreadsheet/multiple-charts folder in the unioffice-examples directory.
cd unioffice-examples/spreadsheet/multiple-charts/
How it works
The import section imports the necessary libraries.
The init function sets the metered license key before running the main function.
The main function is defined in lines 23-59. It starts by creating a new workbook with an empty spreadsheet. Lines 29-33 create the header row. Then the for loop in lines 34-40 creates the rest of the table by populating it with data using:
for r := 0; r < 5; r++ {
  row := sheet.AddRow()
  row.AddCell().SetString(fmt.Sprintf("Product %d", r+1))
  row.AddCell().SetNumber(1.23 * float64(r+1))
  row.AddCell().SetNumber(float64(r%3 + 1))
  row.AddCell().SetFormulaRaw(fmt.Sprintf("C%d*B%d", r+2, r+2))
}
The spreadsheet.Drawing in which all charts will reside in is created in line 43. Then two charts are created in this drawing using:
chrt1, anc1 := dwng.AddChart(spreadsheet.AnchorTypeTwoCell)
chrt2, anc2 := dwng.AddChart(spreadsheet.AnchorTypeTwoCell)
Then from these two chart.Chart objects, bar chart and line chart are created by calling addBarChart(chrt1) and addLineChart(chrt2) in lines 46-47. In lines 48-50, the width and position of the two Anchor objects is set.
The drawing is added to the Sheet using sheet.SetDrawing(dwng). In lines 55-58, the workbook is validated and saved to a file.
The addBarChart function is defined in line 61-85. Inside this function in line 62, the title of the chart is set using chrt.AddTitle().SetText("Bar Chart"). Then a bar chart is added using AddBarChar method of the chart.Chart in line 63. Following this, a new series is added to the bar chart in lines 64-65 using:
priceSeries := lc.AddSeries()
priceSeries.SetText("Price")
The category axis for this series is set in lines 67-68. In lines 69-75, a couple of series are added in the same manner. In lines 78-81, the axis for the bar chart are set.
The addLineChart function defined in lines 87-112. This is used to create the line chart. The process of creating a line chart is the same as creating BarChart, which is defined previously.
Run the code
Use the following command to run the code.
go run main.go
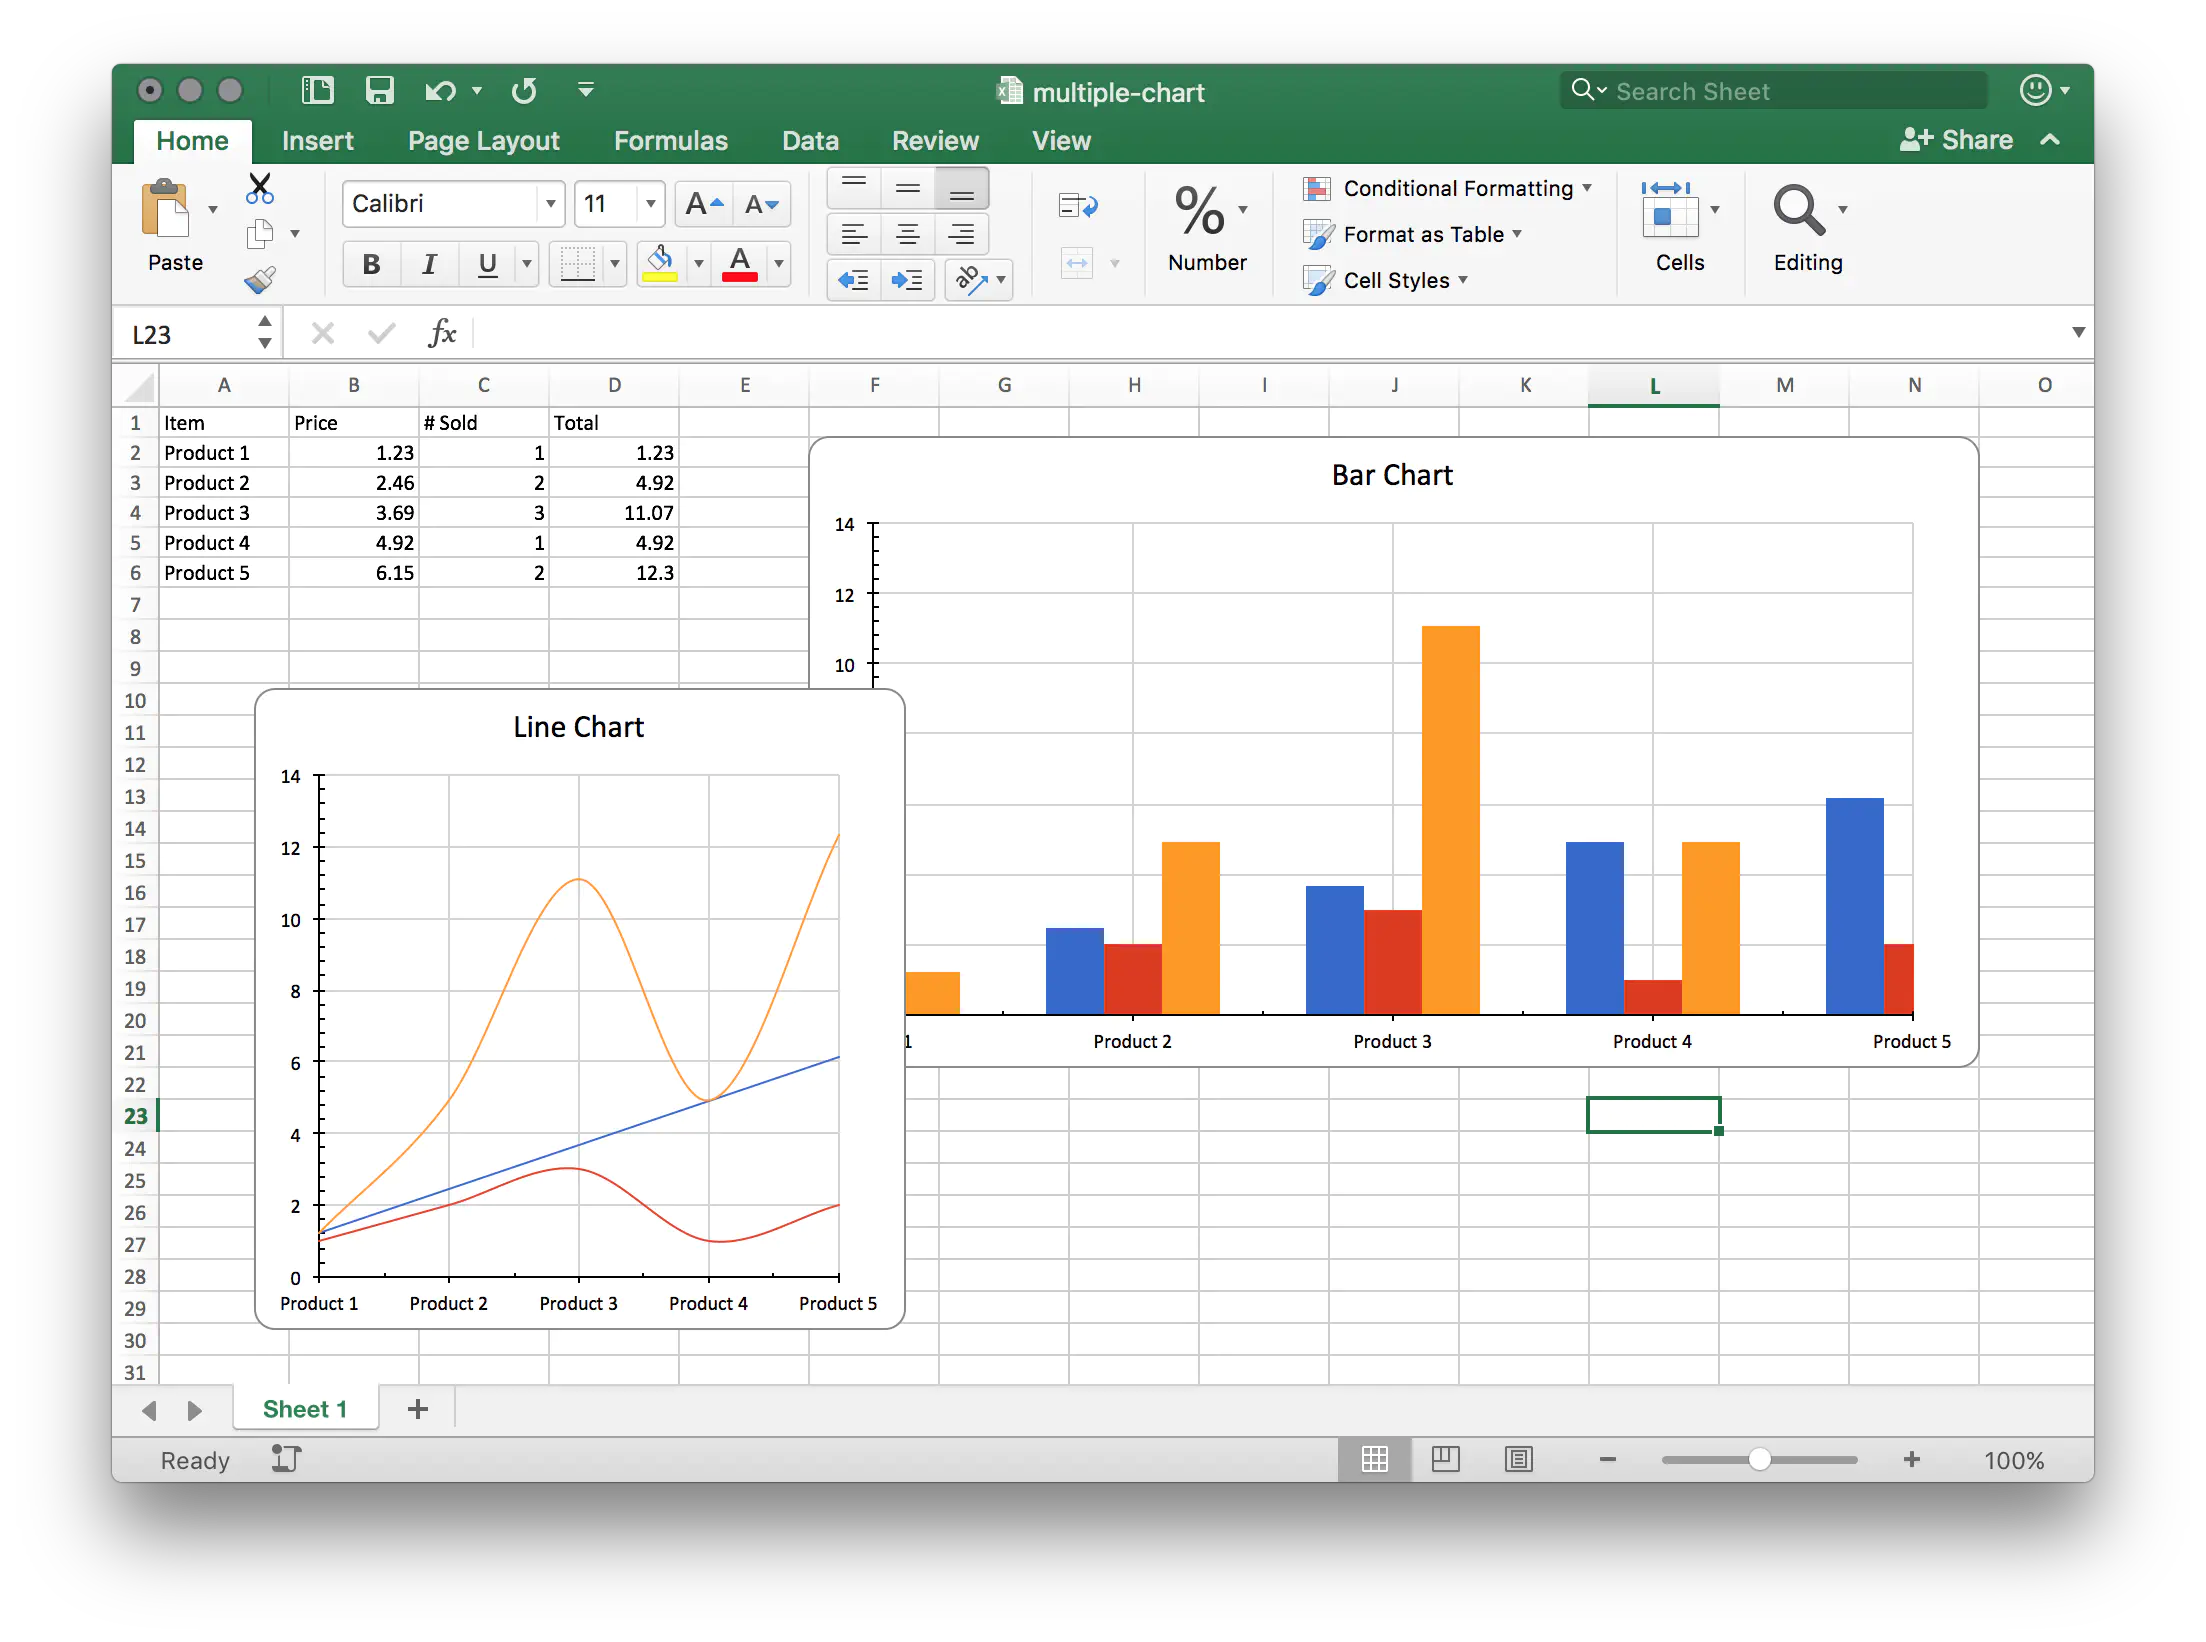
Sample Output