SpreadSheet with Complex content
This guide demonstrates the process of creating a spreadsheet with more complex contents and charts.
Before you begin
You should get your API key from your UniCloud account.
If this is your first time using UniOffice SDK, follow this guide to set up a local development environment.
Clone the project repository
In your terminal, clone the examples repository. It contains the Go code we will be using for this guide.
git clone https://github.com/unidoc/unioffice-examples
To get the example navigate to the path spreadsheet/complex folder in the unioffice-examples directory.
cd unioffice-examples/spreadsheet/complex/
How it works
The code starts by importing necessary packages and setting the metered license key in lines 4-26.
Then in line 29 i.e. inside the main function, creates a new spreadsheet.Workbook using spreadsheet.New(). A new spreadsheet.Sheet is added to the Workbook in line 31. Following this, an empty cell style is created using ss.StyleSheet.AddCellStyle(). In line 35, a spreadsheet.Fill type is created. This will be used to set the fill property of a cell style later. After this a patter of the fill object is set in lines 36-37 using:
pf := f.SetPatternFill()
pf.SetFgColor(color.LightGray)
Then the font of the cell style is set in lines 40-42.
fnt := ss.StyleSheet.AddFont()
fnt.SetBold(true)
hdrStyle.SetFont(fnt)
The header row of the table is created in lines 44-52. Notice that the cell style defined earlier is set to each cell of the header row. Lines 55-56, set the widths of columns 1 and column 4 with some values.
The for loop in lines 58-64, creates the rest of the table rows, one row per loop. The first column contains product number. The second and third columns are set with random floating numbers. This is done using SetNumber(float64(rand.Intn(50) + 1)). The last column is set with product of second and third columns using SetFormulaRaw(fmt.Sprintf("C%d*B%d", r+2, r+2)). Line 67 sets an auto filter using sheet.SetAutoFilter("A1:D6").
An in-cell bar chart is drawn in column 4 based the value it contains. This is done using the following piece of code:
cf := sheet.AddConditionalFormatting([]string{"D2:D6"})
rule := cf.AddRule()
db := rule.SetDataBar()
db.AddFormatValue(sml.ST_CfvoTypeMin, "0")
db.AddFormatValue(sml.ST_CfvoTypeMax, "0")
db.SetColor(color.Blue)
In this sample code a new spreadsheet.ConditionalFormatting is first created. Then a new rule is added using AddRule method of the ConditionalFormatting object. The rule is set to be a DataBarScale using rule.SetDataBar(). After that a couple of format value and color are set to this DataBar rule.
The second column i.e. B2:B6 is colored using spreadsheet.ColorScale rule. This is done in lines 79-87.
Line 90 creates a new drawing using ss.AddDrawing(). This drawing is used to hold the charts to be drawn.
Using AddChart method of the Drawing object, two chart.Chart objects, each with their own anchor object are crated. Then 3D bar chart and Line charts are added to each chart by calling the addBar3DChart and addLineChart functions.
Lines 95-97 set width and position of the anchors.
The drawing is added to the sheet using sheet.SetDrawing(dwng) in line 100. Then spreadsheet validation and writing to file are done in lines 102-105.
The addBar3DChart function in lines 108-133, adds a chart.Bar3DChart to the chart object on the function argument. In this function in line 109, the tile of the chart is set. Using chrt.AddBar3DChart(), a new 3D bar-chart is added in line 110. Then a new BarChartSeries is added, and its text is set in lines 111-112.
The label reference is set using the name pulled from the first column of the table using priceSeries.CategoryAxis().SetLabelReference(`'Sheet 1'!A2:A6`). Then the value of the price series are set from second columns using priceSeries.Values().SetReference(`'Sheet 1'!B2:B6`). The soldSeries and totalSeries are created the same way from the third and fourth columns in lines 117-123. In the rest lines of this function, i.e. 126-132 the axes of the chart are set.
The addLineChart function defined in lines 135-160, creates a 3D line chart. It starts by setting the title of the chart. Then creates Line3DChart using AddLine3DChart() in line 137. Then creates a new chart.LineChartSeries using lc.AddSeries() method call. The text of the series is set using SetText("Price") in line 139. Then the data sources for this series are set in lines 141-142 using:
priceSeries.CategoryAxis().SetLabelReference(`'Sheet 1'!A2:A6`)
priceSeries.Values().SetReference(`'Sheet 1'!B2:B6`)
In lines 114-150, two additional series, namely, soldSeries and totalSeries are added using the following piece of code.
soldSeries := lc.AddSeries()
soldSeries.SetText("Sold")
soldSeries.Values().SetReference(`'Sheet 1'!C2:C6`)

totalSeries := lc.AddSeries()
totalSeries.SetText("Total")
totalSeries.Values().SetReference(`'Sheet 1'!D2:D6`)
Then the axes of this 3D line chart are set in the remaining codes, i.e. 153-160.
Run the code
To create the spreadsheet decorated tables and different charts, run the following command on your terminal.
go run main.go
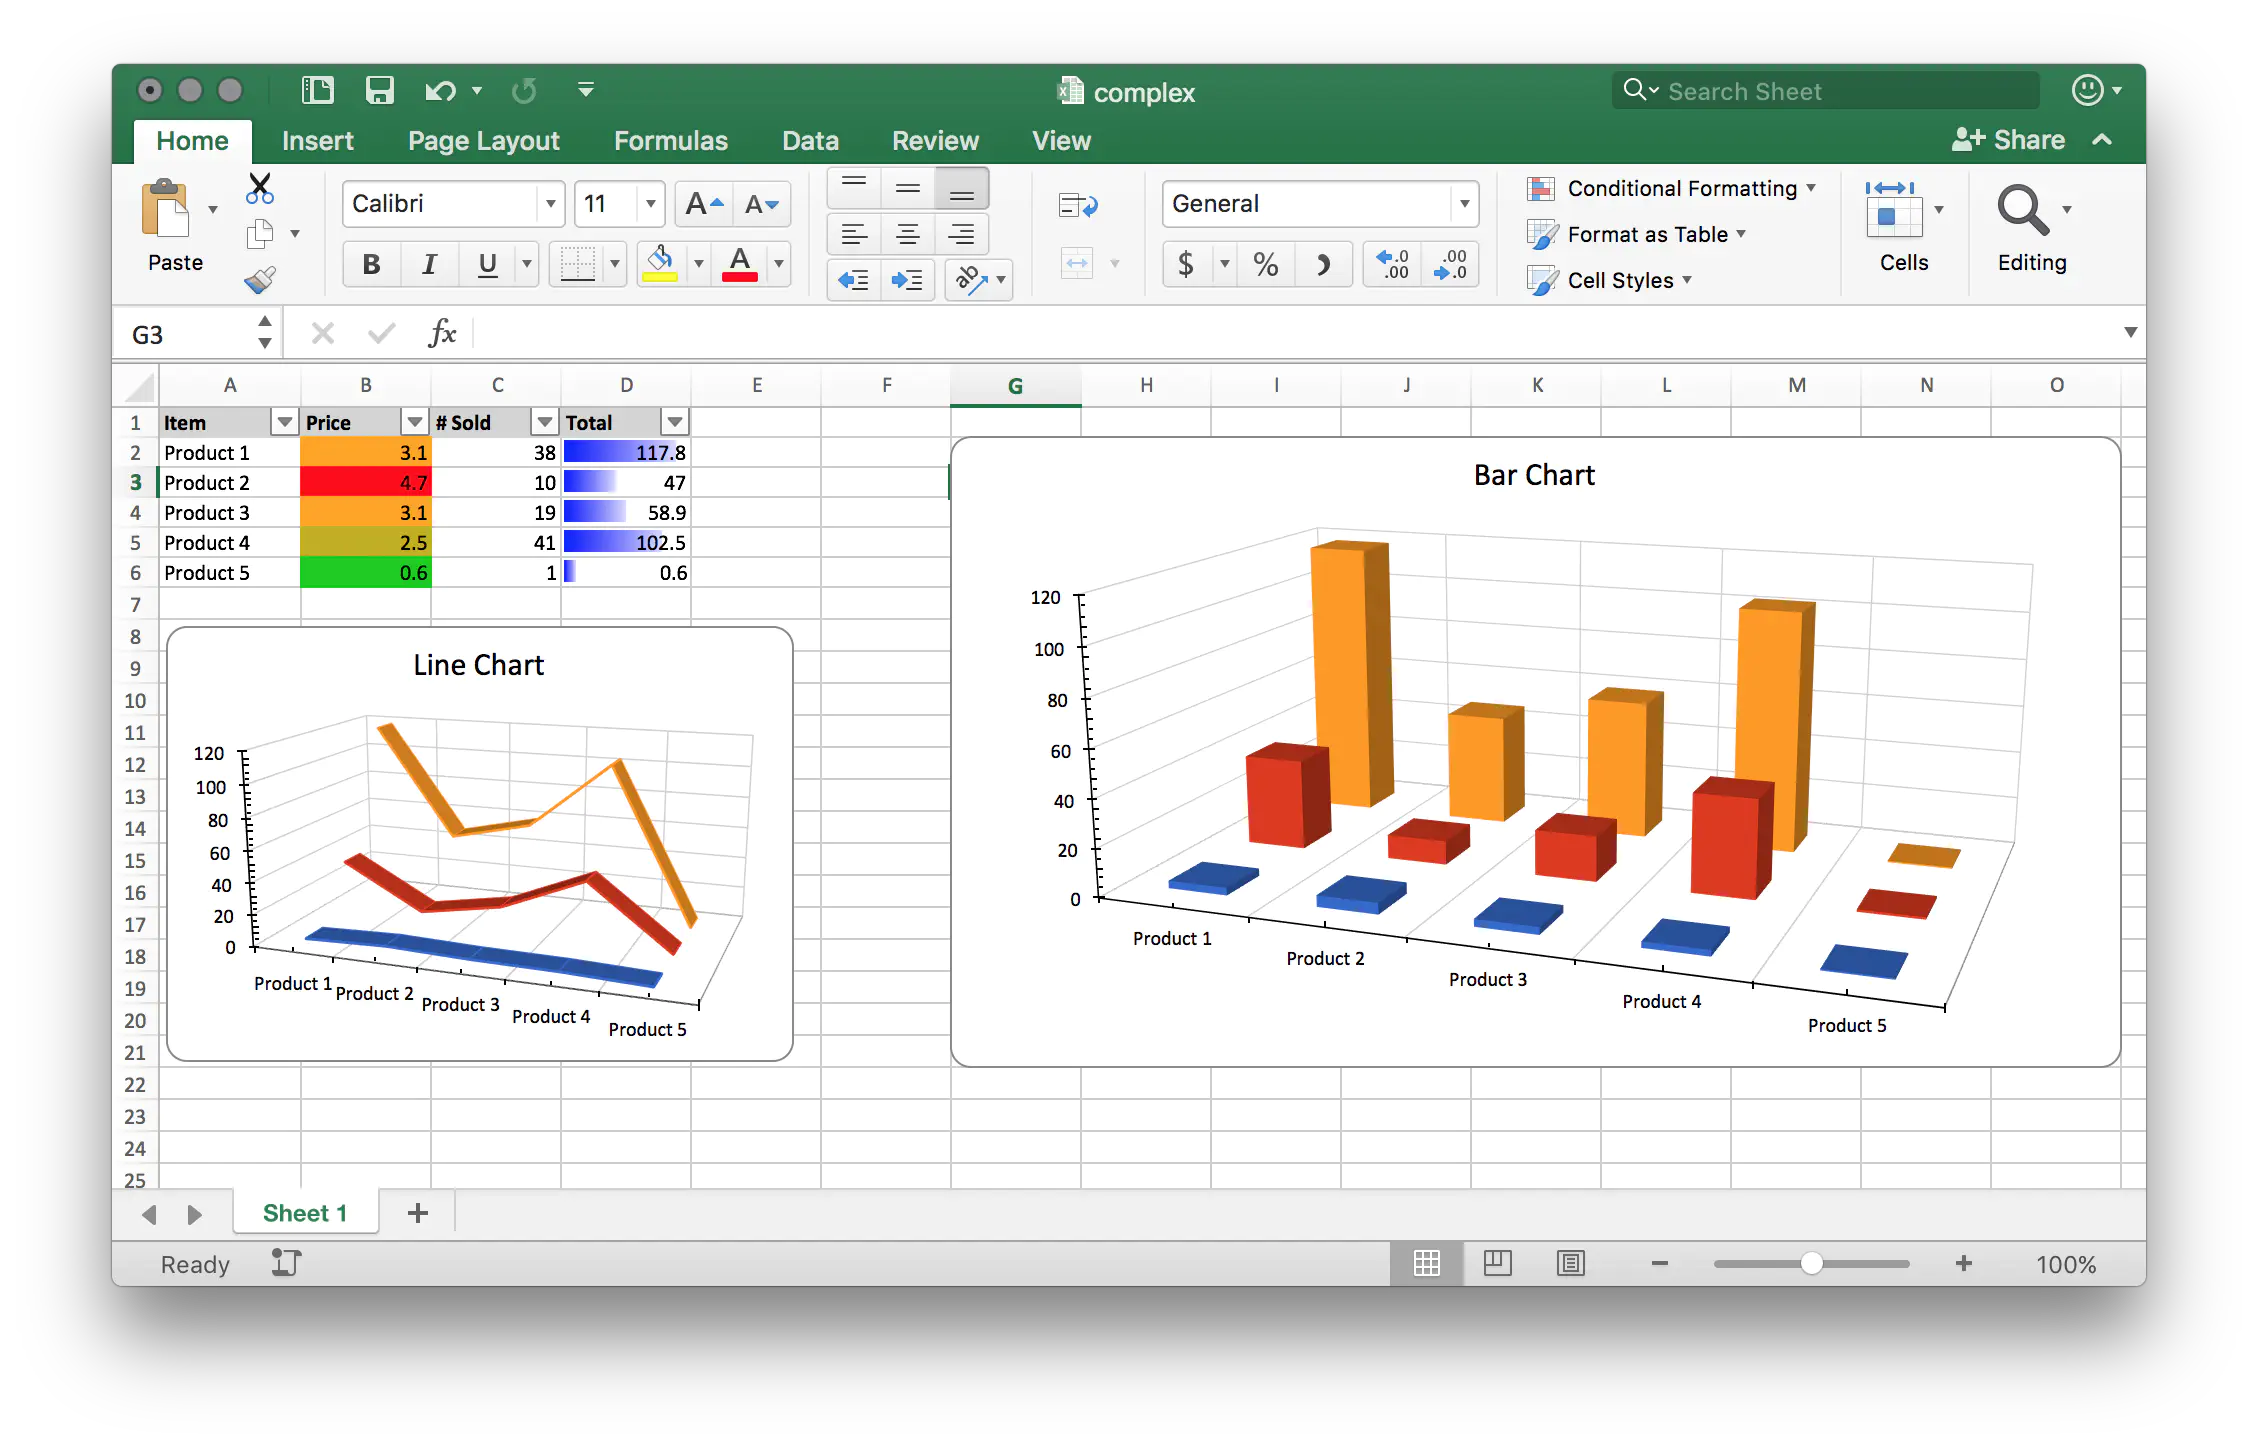
Sample Output