Creating Named Ranges
This guide will show how to create named ranges in UniOffice.
Before you begin
You should get your API key from your UniCloud account.
If this is your first time using UniOffice SDK, follow this guide to set up a local development environment.
Clone the project repository
In your terminal, clone the examples repository. It contains the Go code we will be using for this guide.
git clone https://github.com/unidoc/unioffice-examples
To get the example navigate to the path spreadsheet/named-ranges folder in the unioffice-examples directory.
cd unioffice-examples/spreadsheet/named-ranges/
How it works
First the necessary libraries are imported in lines `4-11`. Then the metered license key is set in the `init` function.The main function starts in line 22. A new workbook is created in line 21-23.
The data is then created in lines 26-37. Then some named ranges are defined in lines 41-44 using:
productNames := ss.AddDefinedName("ProductNames", sheet.RangeReference("A2:A6"))
prices := ss.AddDefinedName("Prices", sheet.RangeReference("B2:B6"))
sold := ss.AddDefinedName("Sold", sheet.RangeReference("C2:C6"))
total := ss.AddDefinedName("Total", sheet.RangeReference("D2:D6"))
The for loop in lines 46-48 iterates through the defined names in the spreadsheet and prints them.
After this a line chart is created be using the named ranges defined previously.
The process of creating the line chart is the same as the linechart guide. The only difference here is defined names are used instead of sheet or cell references.
Finally, the workbook is validated and saved file in lines 87-90.
Run the code
Use the following command to run the code.
go run main.go
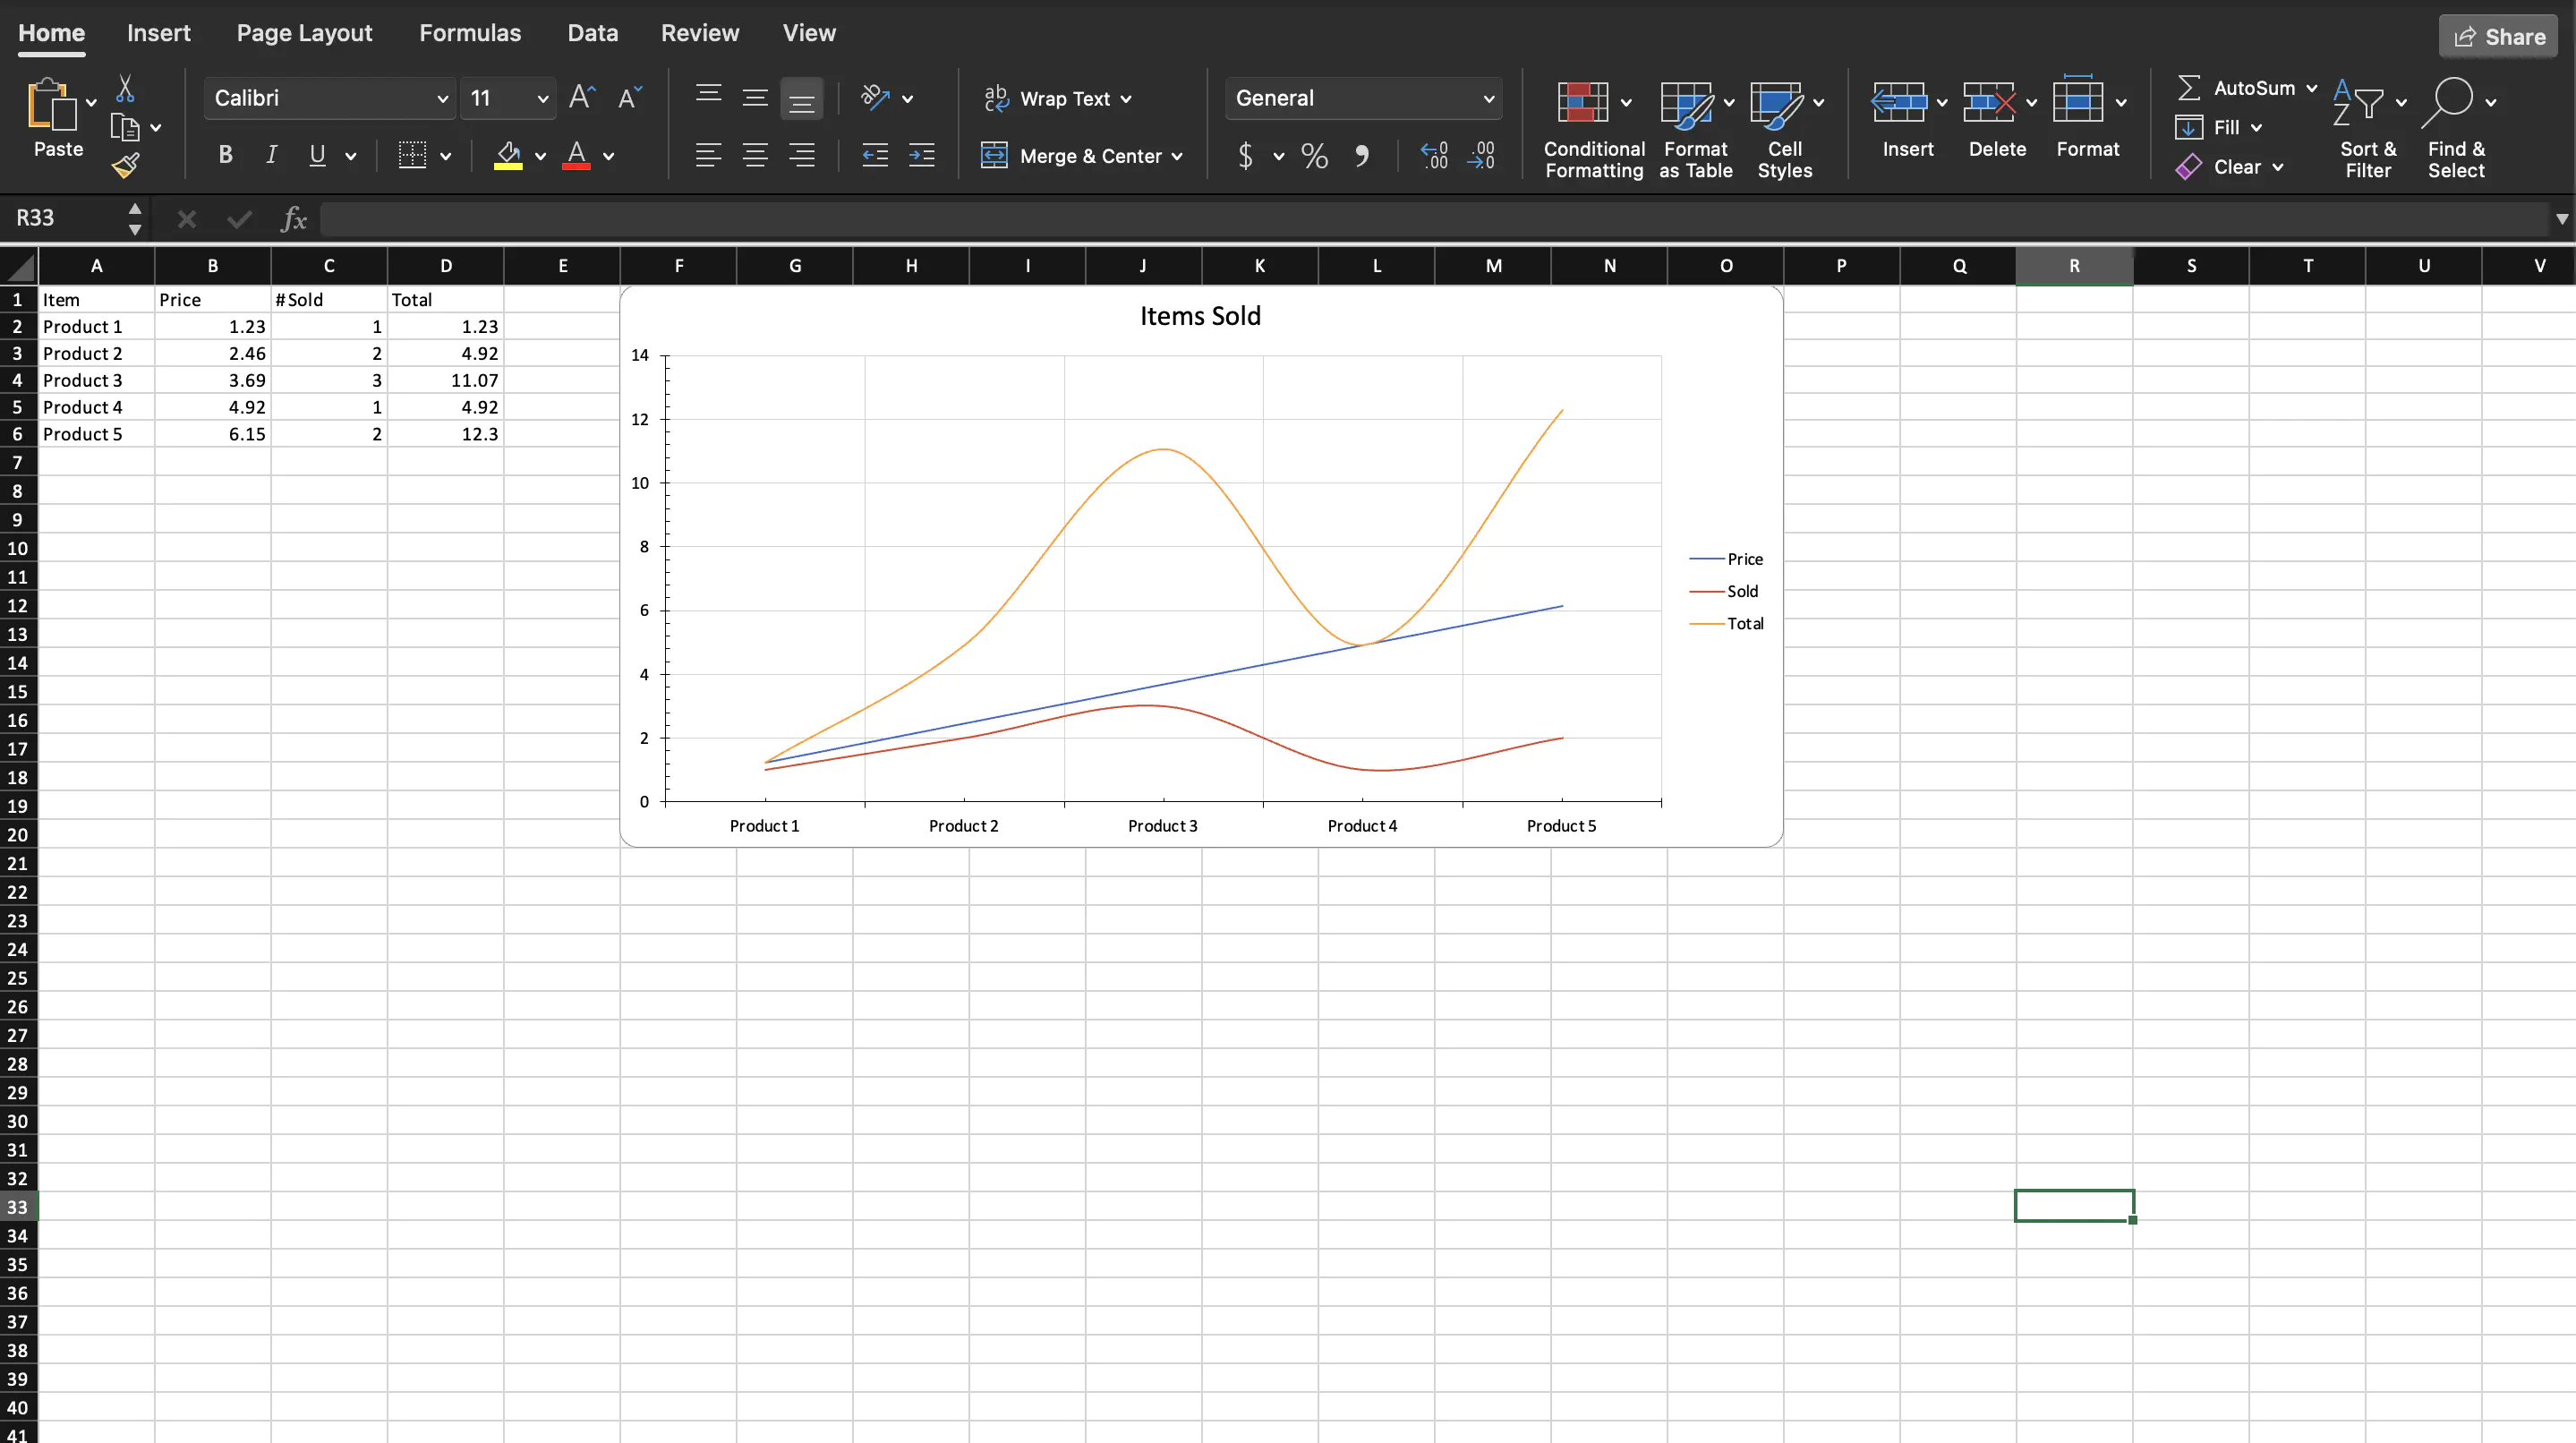
Sample Output