Charts as Pictures
What lands in the document here is an image, not a chart. There is no live chart object, nothing for a reader to click into, no linked data to refresh, and no “Edit Data” in Word’s ribbon. The chart is rendered to a PNG first and inserted the same way any other picture is.
If that is not what you want, the answer is not on this page. UniOffice builds
real, editable charts in spreadsheets through Drawing.AddChart in the
spreadsheet package. The document package has no exported equivalent, so a
Word document gets a picture or nothing.
For a report where the numbers are fixed at generation time, a picture is usually the right call anyway. It renders identically everywhere, it cannot fall out of sync with a data range, and it survives conversion to PDF.
The pipeline
Four steps, three of them outside UniOffice:
- Build the chart with unichart.
- Draw it into a PDF with the UniPDF
creator. - Render that PDF page to a PNG with UniPDF’s
render.ImageDevice. - Load the PNG and place it in the document.
Only the last step is UniOffice, and it is the ordinary two-call image sequence:
img, err := common.ImageFromFile("preview.png")
if err != nil {
    log.Fatalf("unable to create image: %s", err)
}

imgRef, err := doc.AddImage(img)
if err != nil {
    log.Fatalf("unable to add image to document: %s", err)
}

anchored, err := doc.AddParagraph().AddRun().AddDrawingAnchored(imgRef)
if err != nil {
    log.Fatalf("unable to add anchored image: %s", err)
}
anchored.SetName("Chart")
anchored.SetSize(2*measurement.Inch, 2*measurement.Inch)
Any PNG works. If your charts come from a plotting library, a reporting service
or a designer, skip the first three steps entirely and start at
common.ImageFromFile. The example marks that point in the code with a comment.
SetName is what Word shows as the picture description and alt text, so it is
worth a real label like “Q3 revenue by region” rather than “Chart”.
What the rendering half costs you
The example imports github.com/unidoc/unipdf/v5, github.com/unidoc/unichart
and github.com/unidoc/unioffice/v2, and sets a metered license key for both
UniPDF and UniOffice. They read the same UNIDOC_LICENSE_API_KEY environment
variable, so one key covers both, but both SetMeteredKey calls have to happen
before anything else runs.
Resolution is decided once, when the PDF is rasterized, by the OutputWidth
field on the render.ImageDevice. The example sets 2000 pixels and then draws
the result at two inches wide, so there is plenty of detail left for print and
for conversion to PDF. Lower it and the picture goes soft at exactly the point
where you can no longer do anything about it, and nothing warns you.
The example crops whitespace off the rendered page before inserting it, because the PDF page is much larger than the chart drawn on it. Without that step you would be placing a mostly empty page as your picture and the chart inside it would be tiny.
Limitations
Sizing the drawing to a square when the chart is not square distorts it.
SetSize takes width and height independently and does not preserve the aspect
ratio; use imgRef.RelativeHeight to derive the height from the width you want.
The example writes output.pdf and overwrites preview.png in its own
directory as it runs. It is a pipeline demonstration, not a helper you can drop
into a service unchanged; in a real application render into a temporary
directory.
Run the example
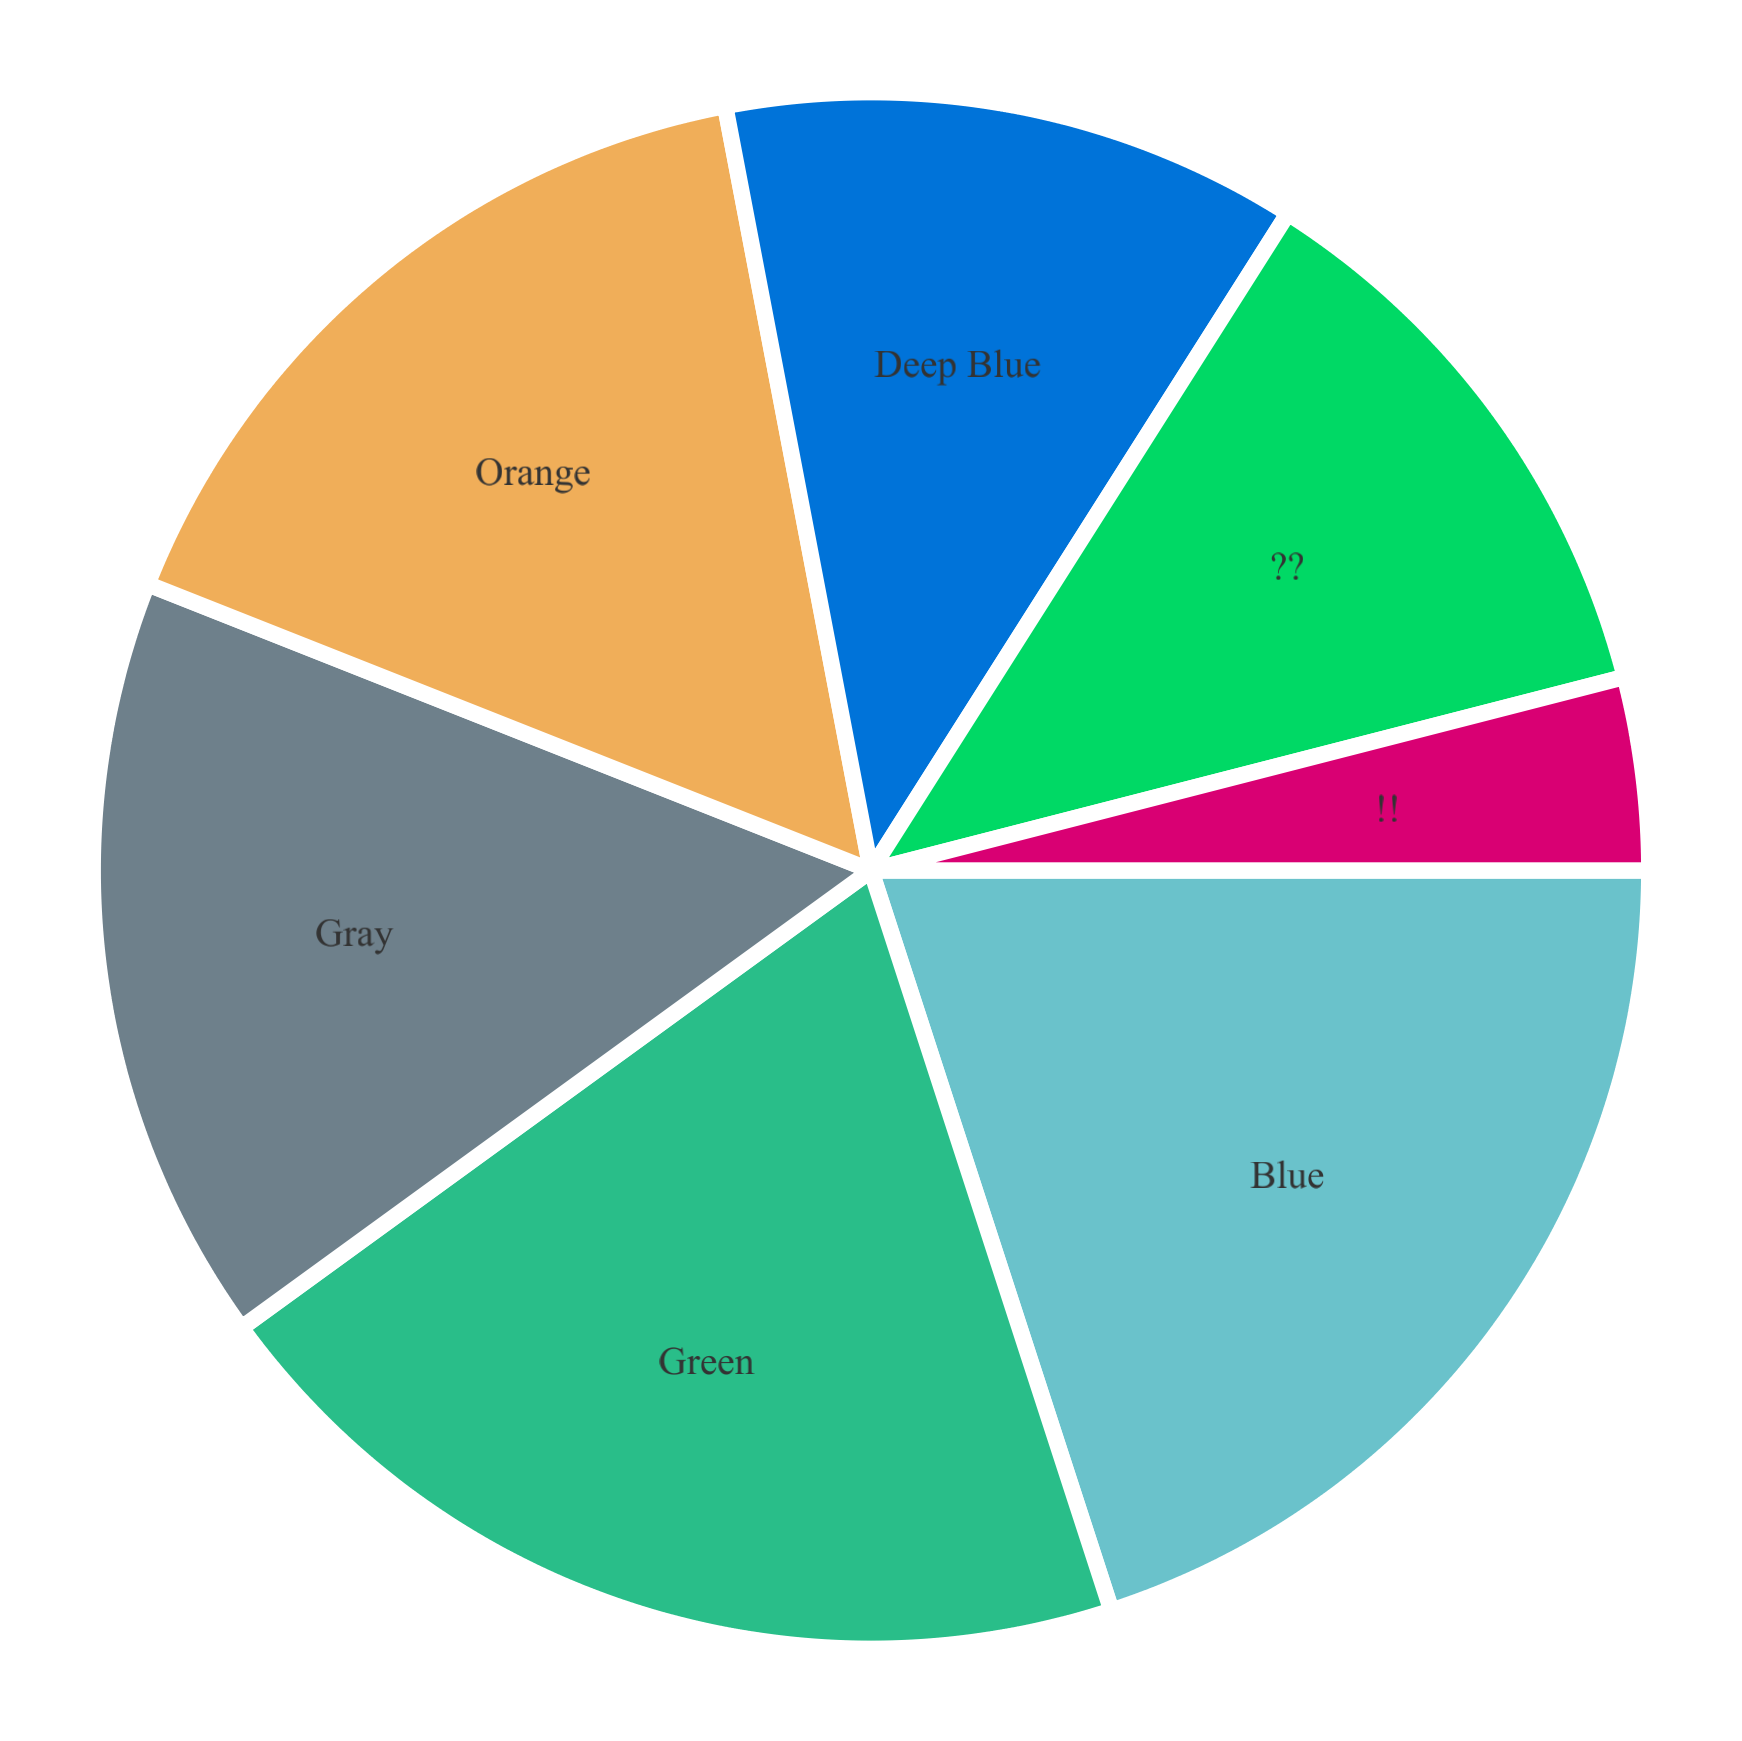
The example builds a unichart.PieChart with seven slices, draws it into a PDF
via the UniPDF creator, renders page one to preview.png, crops it to the chart
bounds, and anchors the result in a new document. renderPDFToImage is the
function that does the rasterizing and cropImage the trimming.
git clone https://github.com/unidoc/unioffice-examples.git
cd unioffice-examples/document/chart
go run main.go
If this is your first time using UniOffice, follow the getting started guide to create an API key and set up your development environment.
View the full source
Sample output
The rendered chart image, before it is placed in the document.