Tables
slide.AddTable() puts a table on a slide and returns a common.Table. Columns
and rows are added separately, cells come into existence as a side effect, and
the content of a cell is written with the raw DrawingML types rather than
through a wrapper. That last part is what makes a first table longer than
expected.
Order does not matter much: AddCol appends a cell to every row that already
exists, and AddRow creates one cell per column that already exists. What does
matter is that row.Cells() only returns cells for the columns present when you
ask, so add all the columns first if you intend to iterate rows.
Building a table
tbl := slide.AddTable()
for ci := 0; ci < 4; ci++ {
    tbl.AddCol().SetWidth(measurement.Millimeter * 52)
}
for ri := 0; ri < 3; ri++ {
    row := tbl.AddRow()
    row.SetHeight(measurement.Inch)
    for ci, cell := range row.Cells() {
        cell.TxBody = dml.NewCT_TextBody()
        para := dml.NewCT_TextParagraph()
        cell.TxBody.P = append(cell.TxBody.P, para)

        egtr := dml.NewEG_TextRun()
        para.EG_TextRun = append(para.EG_TextRun, egtr)
        egtr.TextRunChoice.R = dml.NewCT_RegularTextRun()
        egtr.TextRunChoice.R.T = fmt.Sprintf("Cell %d:%d", ri, ci)
    }
}
tbl.SetOffsetX(measurement.Inch)
tbl.SetOffsetY(measurement.Millimeter * 20)
Cells() returns []*dml.CT_TableCell, a schema type with no SetText, so
each cell is built as a text body containing a paragraph containing a run. That
is the same three-level structure a text box has, minus the wrappers. If you are
filling many cells, wrap those six lines in a local helper.
SetWidth on a column and SetHeight on a row both take a
measurement.Distance. The table frame carries only an offset; its overall size
follows from the column widths and row heights, so there is no separate call to
size the table itself.
Styling
SetStyle takes a *dml.CT_TableStyle you build by hand:
style := dml.NewCT_TableStyle()
style.WholeTbl = dml.NewCT_TablePartStyle()
tcStyle := dml.NewCT_TableStyleCellStyle()
tcStyle.ThemeableFillStyleChoice.Fill = dml.NewCT_FillProperties()
tcStyle.ThemeableFillStyleChoice.Fill.FillPropertiesChoice.SolidFill = dml.NewCT_SolidColorFillProperties()
tcStyle.ThemeableFillStyleChoice.Fill.FillPropertiesChoice.SolidFill.SrgbClr = dml.NewCT_SRgbColor()
tcStyle.ThemeableFillStyleChoice.Fill.FillPropertiesChoice.SolidFill.SrgbClr.ValAttr = "FF9900"
style.WholeTbl.TcStyle = tcStyle
tbl.SetStyle(style)
WholeTbl applies to every cell. The schema also has band, first-row and
first-column parts for the striping PowerPoint offers, set the same way. If the
deck came from a template, ppt.GetTableStyleById(id) returns a style already
defined in its table styles part, which saves rebuilding one.
Limitations
A table added to a slide starts at an offset of one EMU rather than zero,
because a table at the true origin is not rendered. Setting your own offset with
SetOffsetX or SetOffsetY replaces it. Setting only one of the two fills the
other with zero, since a frame with just one coordinate makes the file
unopenable.
Reading tables back has a side effect. slide.Tables() builds each wrapper
through common.NewTableFromTbl, which assigns fresh table properties to the
underlying dml.Tbl. Since that pointer belongs to the opened document, merely
listing the tables on a slide discards the table properties already there,
including its style. Do not call Tables() on a deck you intend to save
unchanged.
There are no merged cells, no per-cell borders and no header rows in this API.
Anything beyond a uniform grid has to be written against the schema types under
Cells().
Run the example
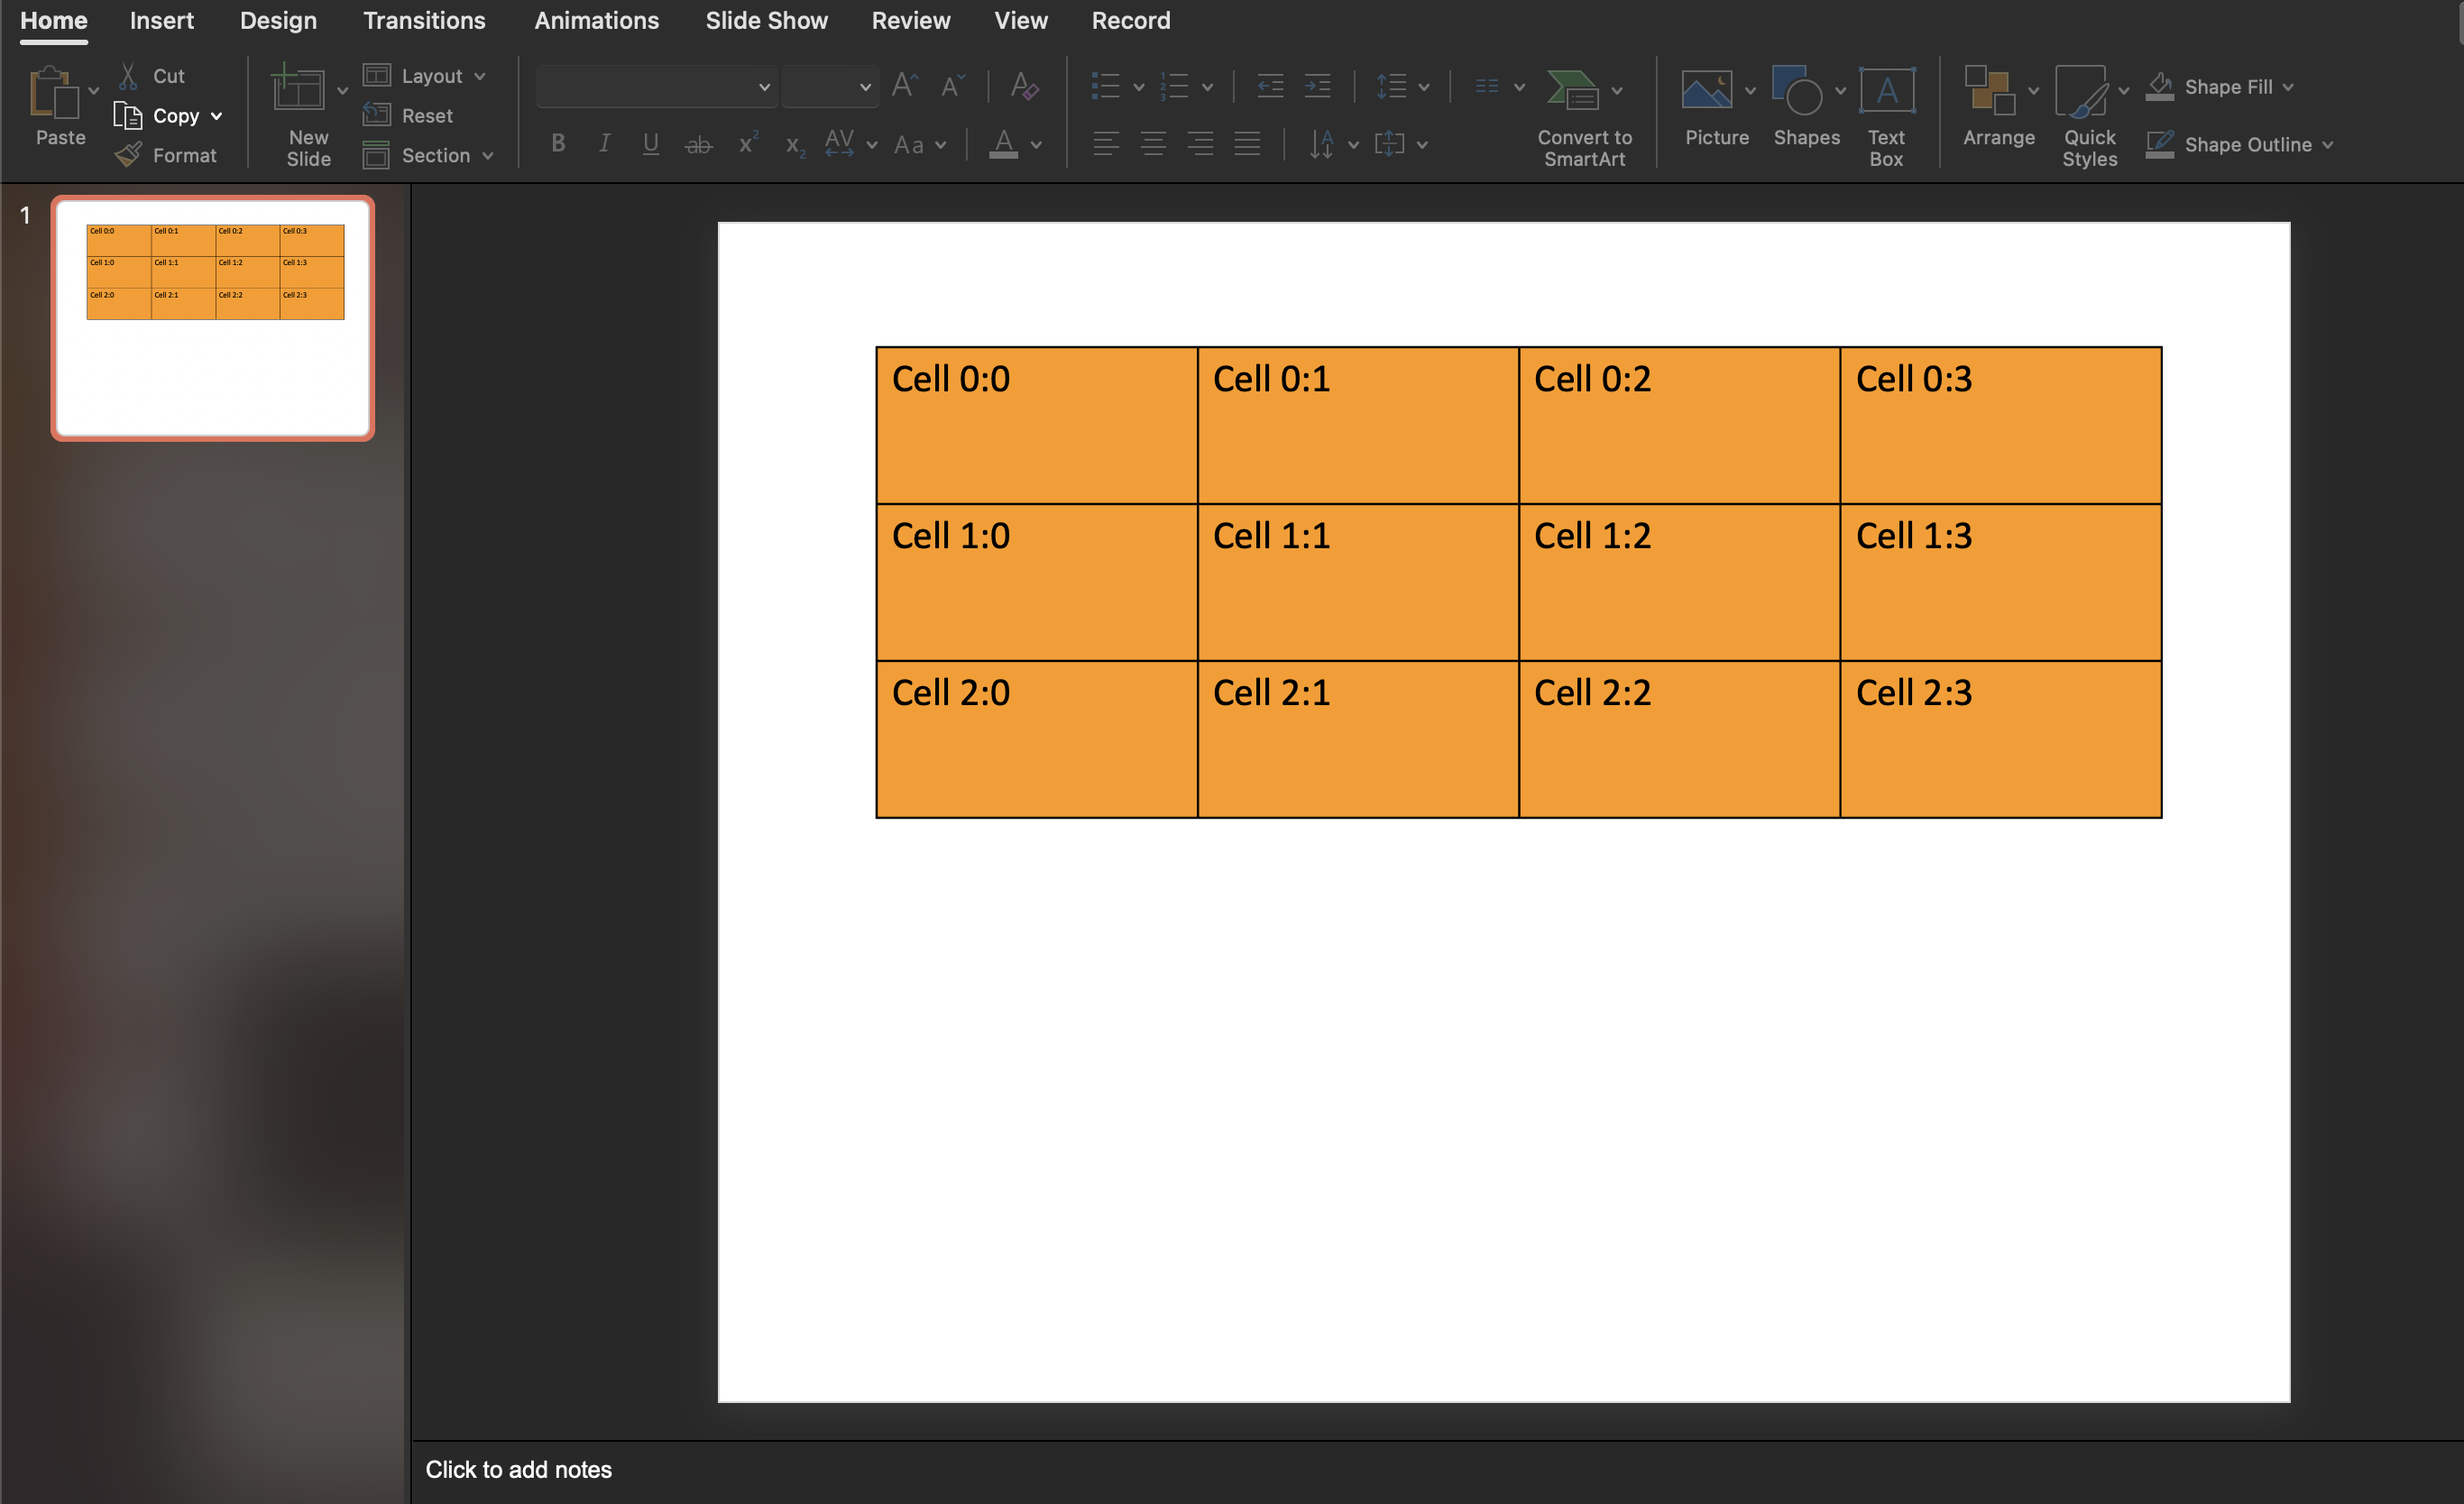
The example creates a four column by three row table on a new slide, fills each
cell with its coordinates, fills the whole table orange and saves out.pptx.
git clone https://github.com/unidoc/unioffice-examples.git
cd unioffice-examples/presentation/tables
go run main.go
If this is your first time using UniOffice, follow the getting started guide to create an API key and set up your development environment.
View the full source
Sample output