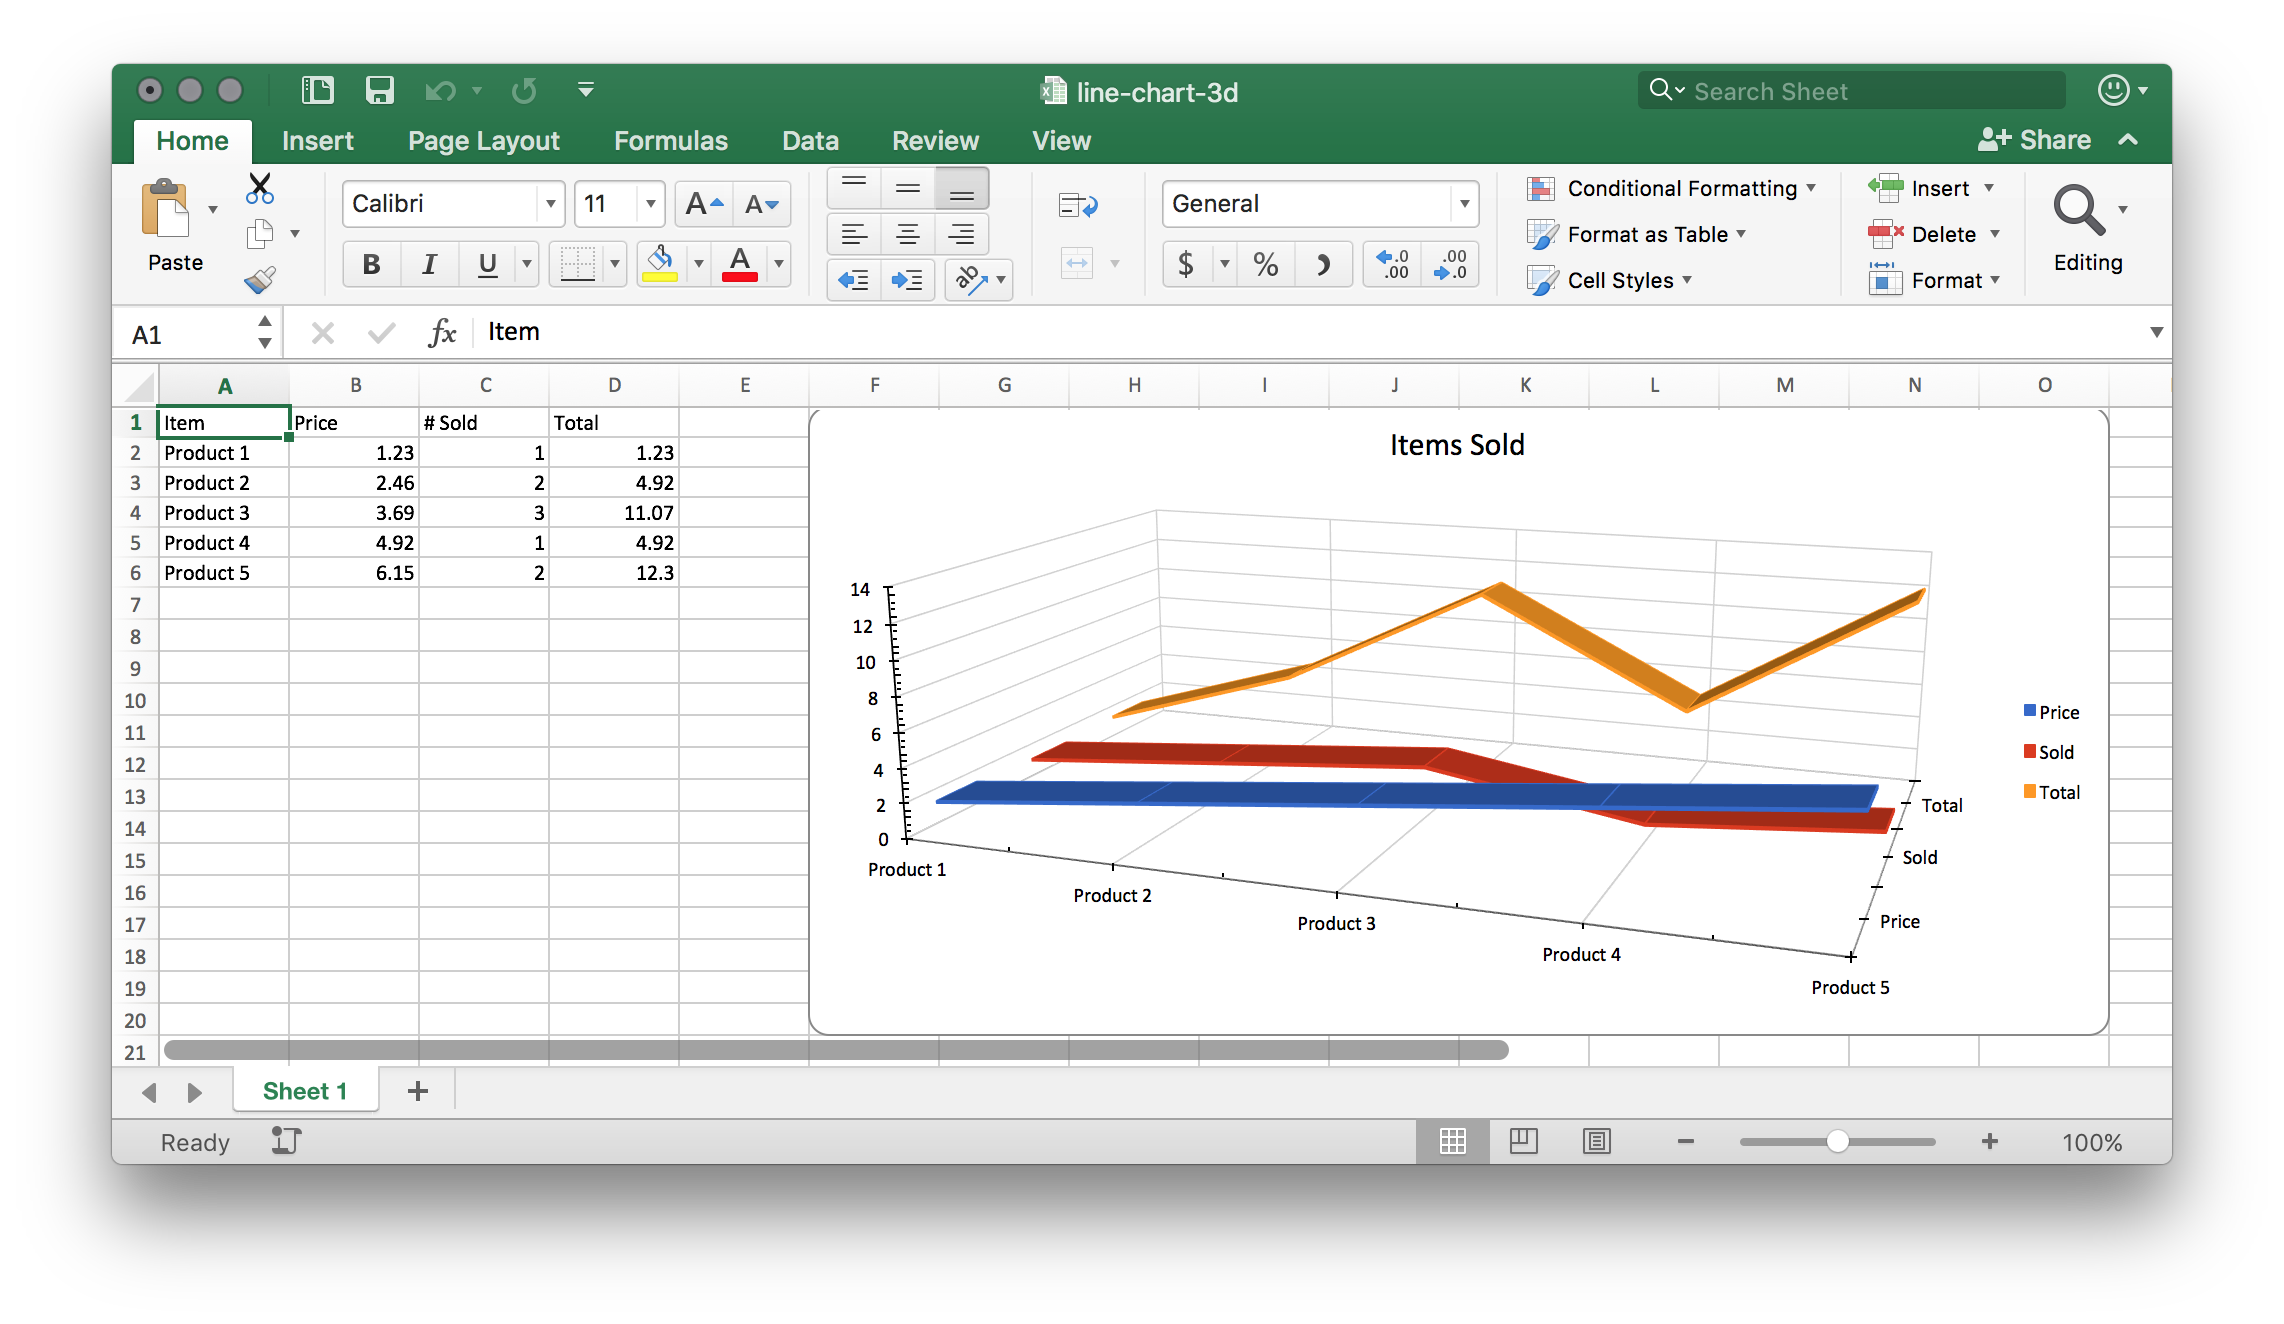
3D Line Chart
AddLine3DChart gives each series its own row in depth instead of stacking them
all on one plane. That separation is the only reason to pick it: with three or
four series whose lines cross each other repeatedly, a flat
line chart turns into a tangle, and pushing the series apart
makes each one readable again. It costs you the ability to compare values across
series at a glance, so the trade is legibility for comparability.
The data shape is identical to the flat chart. Both return LineChartSeries, and
the series code can be moved between them unchanged.
Adding the chart
dwng := ss.AddDrawing()
crt, anc := dwng.AddChart(spreadsheet.AnchorTypeTwoCell)
anc.SetWidthCells(10)

lc := crt.AddLine3DChart()
priceSeries := lc.AddSeries()
priceSeries.SetText("Price")
priceSeries.CategoryAxis().SetLabelReference(`'Sheet 1'!A2:A6`)
priceSeries.Values().SetReference(`'Sheet 1'!B2:B6`)
What changes is the axes. A 3D plot needs a third one, the series axis, which is what the depth direction is measured along:
ca := crt.AddCategoryAxis()
va := crt.AddValueAxis()
sax := crt.AddSeriesAxis()
lc.AddAxis(ca)
lc.AddAxis(va)
lc.AddAxis(sax)

ca.SetCrosses(va)
va.SetCrosses(ca)
sax.SetCrosses(va)
Nothing will tell you if you skip it. Workbook.Validate walks the sheets and
their cells; it never looks at the charts, so a plot with a missing or
unattached axis saves without complaint and only shows up when the file is
opened.
AddLine3DChart also installs a 3D view on the chart: 15 degrees of X rotation,
20 degrees of Y, right-angle axes off, and floor, side wall and back wall all at
zero thickness. Those are set on the chart, not the plot, so adding a second plot
type to the same chart inherits them.
Limitations
There is no exported setter for the viewing angle. Changing it means reaching
into crt.X().Chart.View3D and setting RotX, RotY or Perspective on the
wrapped XML.
The 3D series is filled as well as outlined. Line3DChart.AddSeries applies the
palette color to both the line properties and the shape properties, where the
flat LineChart.AddSeries sets only the line, so a series you style yourself
needs both overriding.
Depth ordering follows series index. There is no way to reorder the rows other
than adding the series in the order you want them, or calling SetOrder on the
series afterwards.
Run the example
The example is the flat line chart example with AddLine3DChart and a series
axis substituted in, which makes it a useful diff to read side by side.
git clone https://github.com/unidoc/unioffice-examples.git
cd unioffice-examples/spreadsheet/line-chart-3d
go run main.go
If this is your first time using UniOffice, follow the getting started guide to create an API key and set up your development environment.
View the full source
Sample output