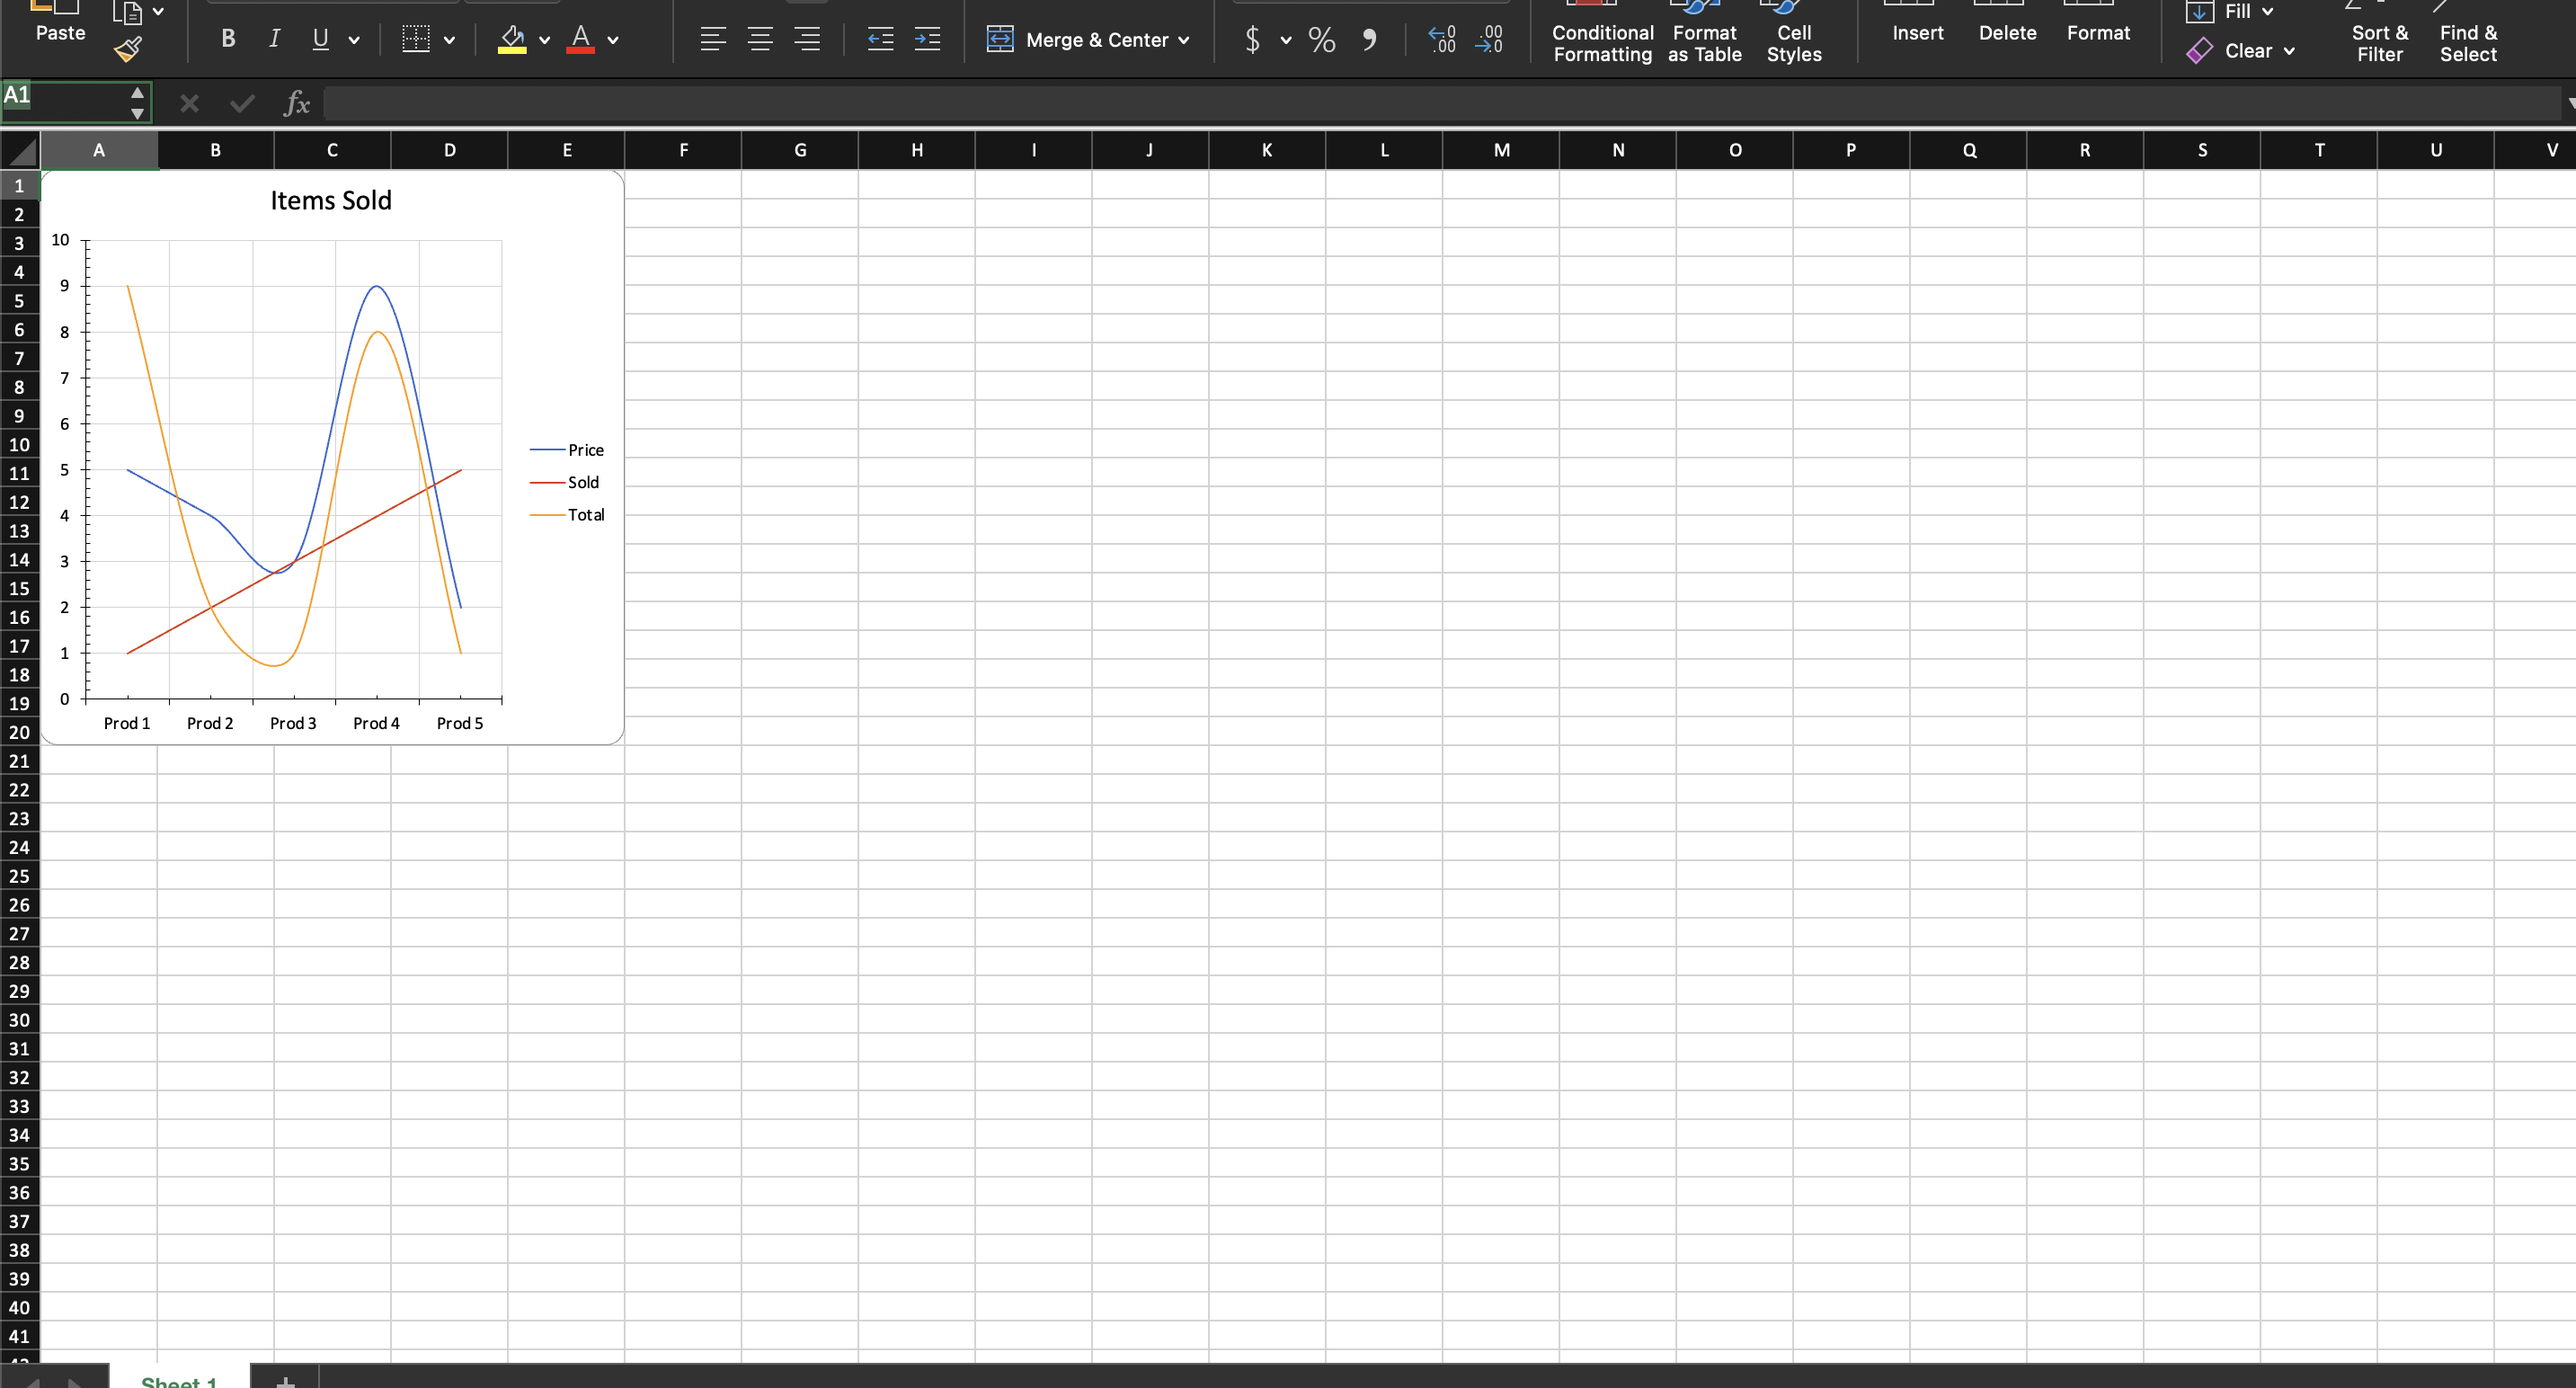
Line Chart with No Data
Charts normally read their numbers out of cells, which means a chart of computed
values forces you to write those values into a sheet whether you want them
visible or not. SetValues avoids that. The numbers are embedded in the chart
itself, the worksheet stays empty, and the reader sees a picture with no table
underneath it.
| Source | Call | What lands in the file |
|---|---|---|
| Cells | Values().SetReference("'Sheet 1'!B2:B6") | A range reference Excel resolves on open. |
| Literals | Values().SetValues([]float64{5, 4, 3}) | The numbers themselves, as chart XML. |
Pick literals for a chart of derived figures nobody needs to see in tabular form, or where the input never came from a spreadsheet to begin with. Pick references when the reader should be able to edit a number and watch the chart follow.
Adding the chart
sheet := ss.AddSheet()

dwng := ss.AddDrawing()
chart, anc := dwng.AddChart(spreadsheet.AnchorTypeTwoCell)
anc.MoveTo(0, 0)

lc := chart.AddLineChart()
priceSeries := lc.AddSeries()
priceSeries.SetText("Price")
priceSeries.CategoryAxis().SetValues([]string{"Prod 1", "Prod 2", "Prod 3"})
priceSeries.Values().SetValues([]float64{5, 4, 3})

sheet.SetDrawing(dwng)
The category axis takes strings and the value source takes float64s, and the two have to be the same length. As with a referenced chart, only the first series needs categories.
Everything else is unchanged: the chart still needs a category axis and a value axis attached and crossed, and the sheet still needs the drawing.
Limitations
Literal values are frozen. Excel will not recalculate them, and there is no cell for a reader to edit, so regenerating the file is the only way to change the numbers.
SetValues clears any reference that was set before it, but SetReference does
not clear literal values. Call both on the same source in that order and the
chart XML ends up carrying a literal cache and a reference at once.
Watch the anchor setter. The example uses AnchorTypeTwoCell and then calls
anc.SetWidth(10), which is a no-op on a two-cell anchor, so the chart keeps its
default five-column width. SetWidthCells(10) is the call that resizes a
two-cell anchor. SetWidth also takes a measurement.Distance in points, so
even on a one-cell anchor a bare 10 means ten points.
Run the example
The example produces a workbook whose only sheet holds a chart and nothing else: three series, all supplied as Go slices.
git clone https://github.com/unidoc/unioffice-examples.git
cd unioffice-examples/spreadsheet/line-chart-no-data
go run main.go
If this is your first time using UniOffice, follow the getting started guide to create an API key and set up your development environment.
View the full source
Sample output