Multiple Charts
A worksheet holds one drawing, and a drawing holds many charts. That is the whole
rule, and it is the thing that trips people up: calling ss.AddDrawing() twice
and passing each result to sheet.SetDrawing leaves only the last one attached,
because the sheet keeps a single drawing reference.
So the pattern for several charts on a sheet is one AddDrawing, one
AddChart per chart, and one SetDrawing at the end.
Adding the charts
dwng := ss.AddDrawing()
chrt1, anc1 := dwng.AddChart(spreadsheet.AnchorTypeTwoCell)
chrt2, anc2 := dwng.AddChart(spreadsheet.AnchorTypeTwoCell)

addBarChart(chrt1)
addLineChart(chrt2)

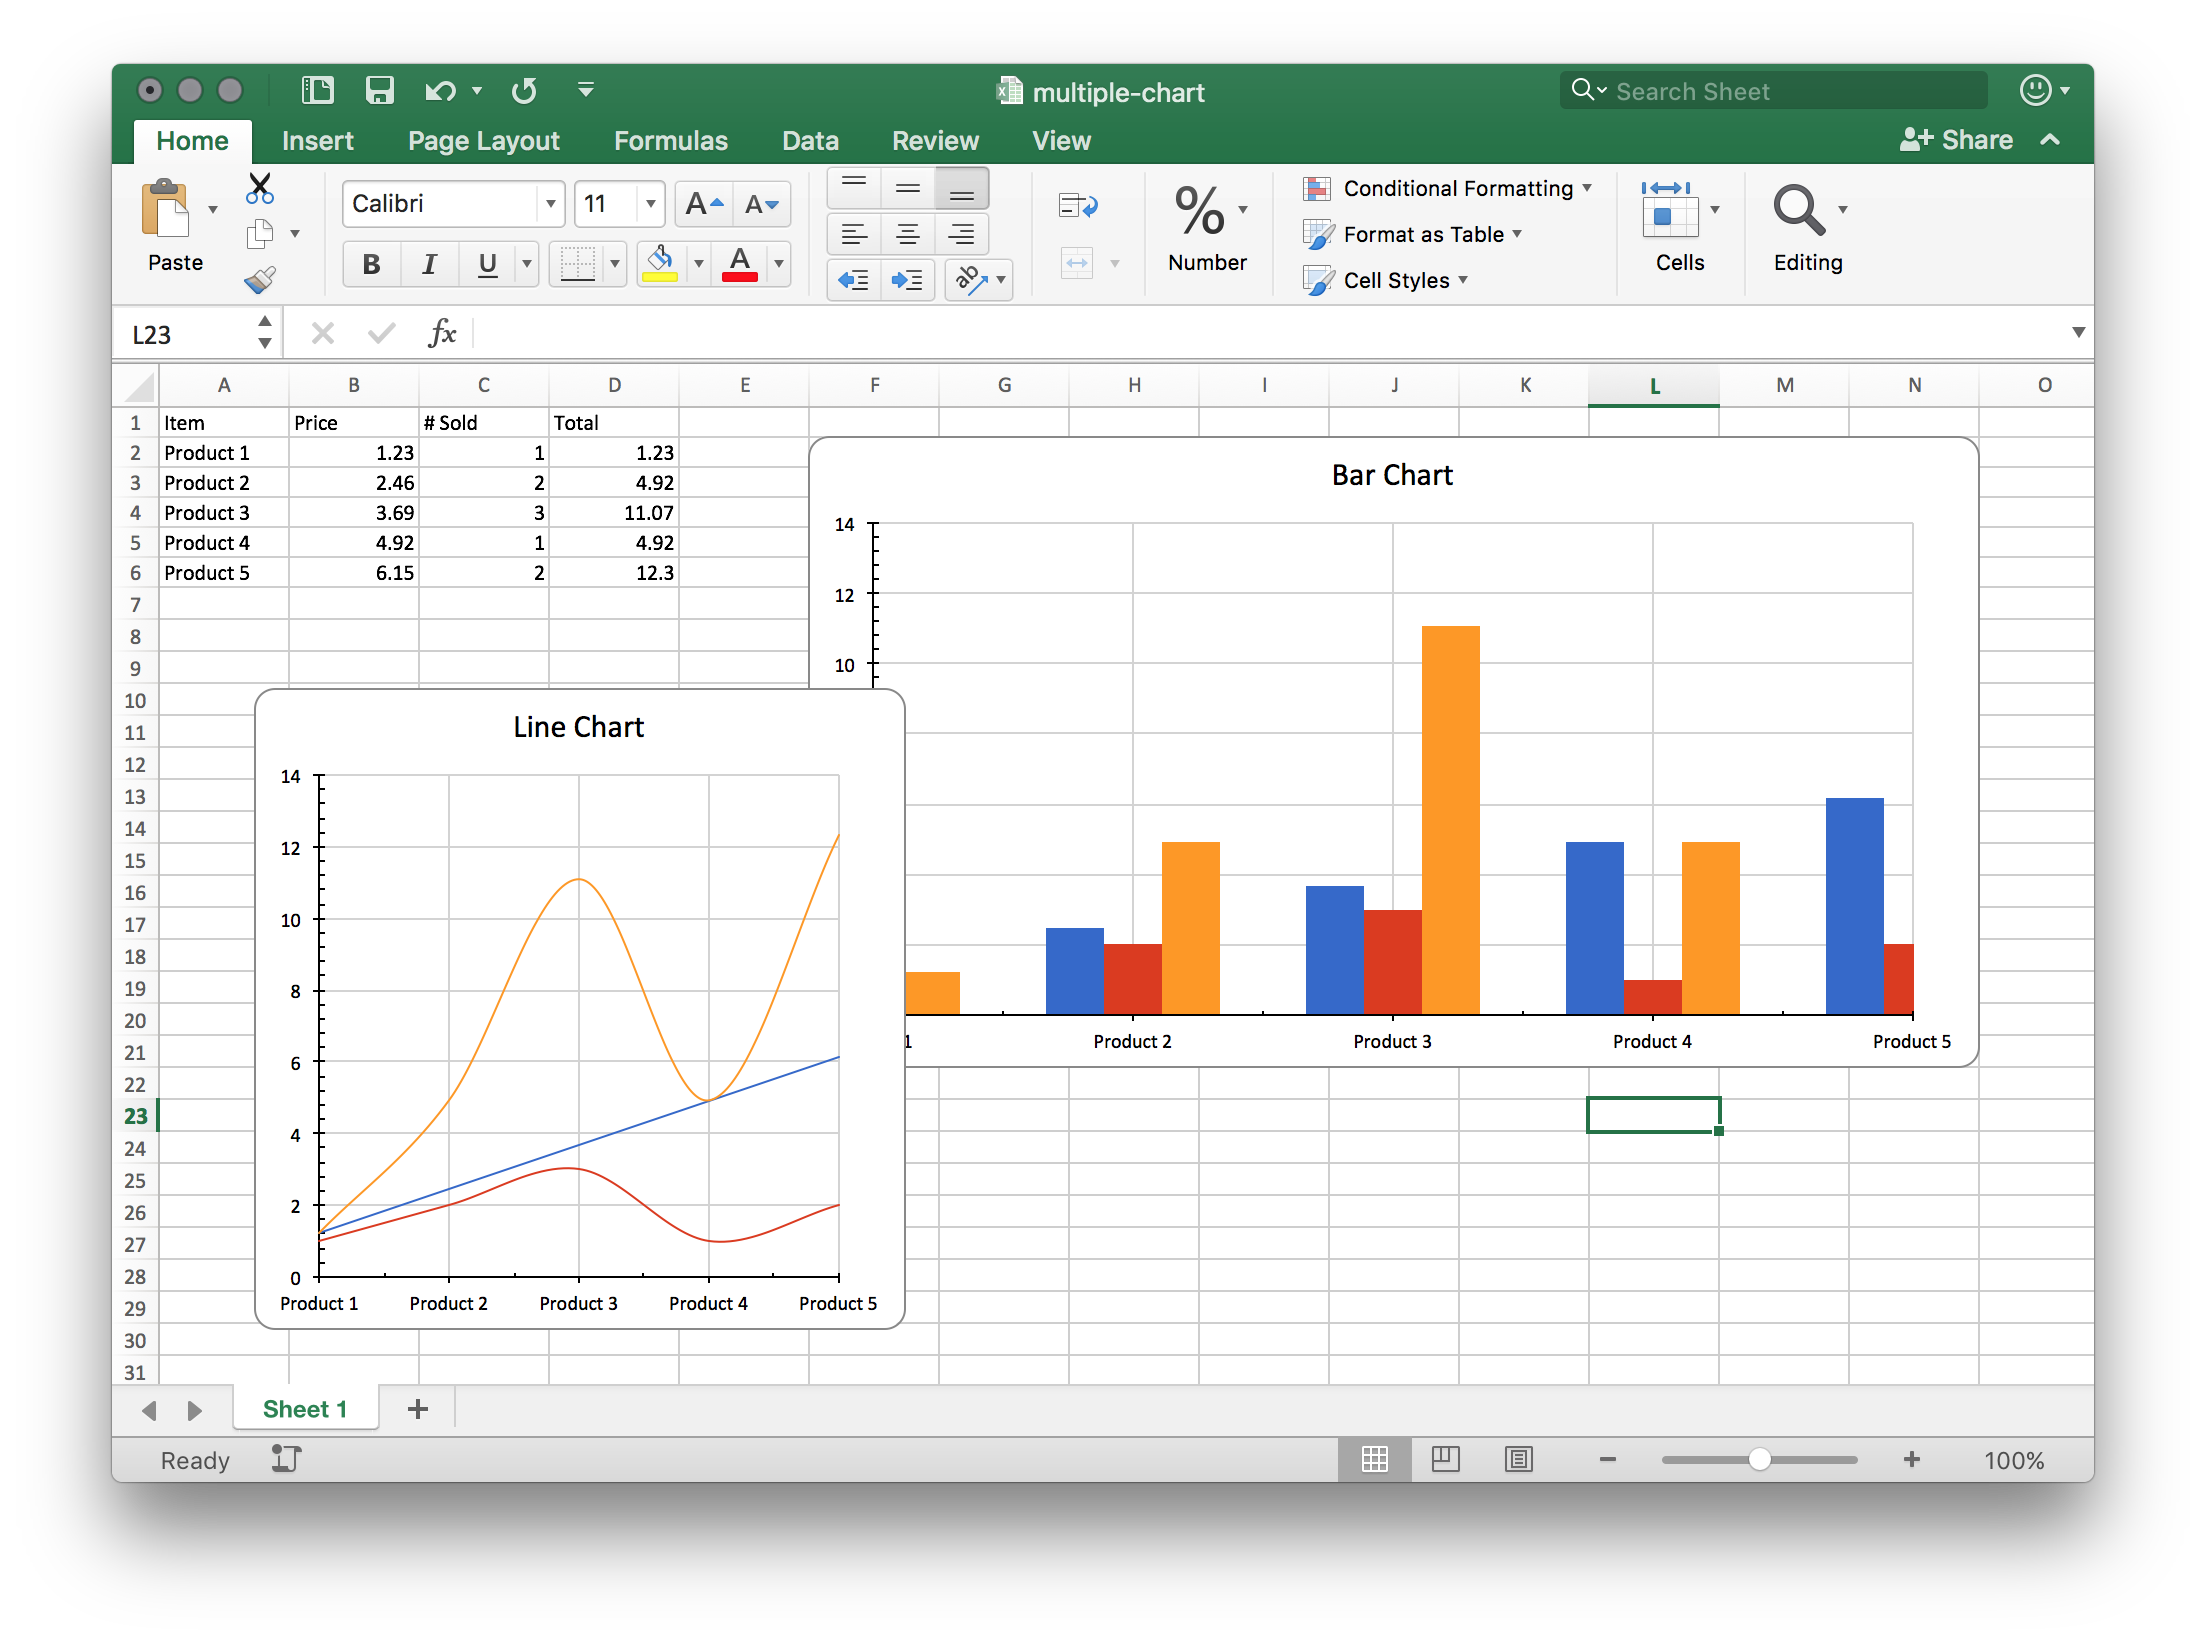
anc1.MoveTo(5, 1)
anc2.MoveTo(1, 23)

sheet.SetDrawing(dwng)
Each AddChart returns its own anchor, and the anchors are what keep the charts
apart. A two-cell anchor defaults to columns F through K and rows 1 through 21,
so two charts left unpositioned land exactly on top of each other. MoveTo(col, row) takes zero-based coordinates and preserves the anchor’s size, which is why
the second chart in the example moves down 23 rows rather than being resized.
Building each chart in its own function keeps the sheet code readable. The
parameter type is chart.Chart, which means importing the chart package
directly:
import "github.com/unidoc/unioffice/v2/chart"

func addBarChart(chrt chart.Chart) {
    chrt.AddTitle().SetText("Bar Chart")
    bc := chrt.AddBarChart()
    // series and axes as usual
}
Charts on the same drawing share nothing else. Each has its own axes, title, legend and series colors, and each series color sequence restarts from the top of the palette.
Limitations
Anchors do not check for overlap. Two charts whose cell ranges intersect are
drawn on top of each other with no warning, and Workbook.Validate does not look
at the drawing.
SetWidth on a two-cell anchor is a no-op, which the example runs into: it calls
anc1.SetWidth(9) and the chart keeps its default five-column width.
SetWidthCells(9) is the call that has an effect.
Charts and images live on the same drawing. A sheet that already has an anchored image must add its charts to that drawing rather than creating a new one.
Run the example
The example puts a bar chart and a line chart over the same product table, each built by its own function so the two are easy to compare.
git clone https://github.com/unidoc/unioffice-examples.git
cd unioffice-examples/spreadsheet/multiple-charts
go run main.go
If this is your first time using UniOffice, follow the getting started guide to create an API key and set up your development environment.
View the full source
Sample output