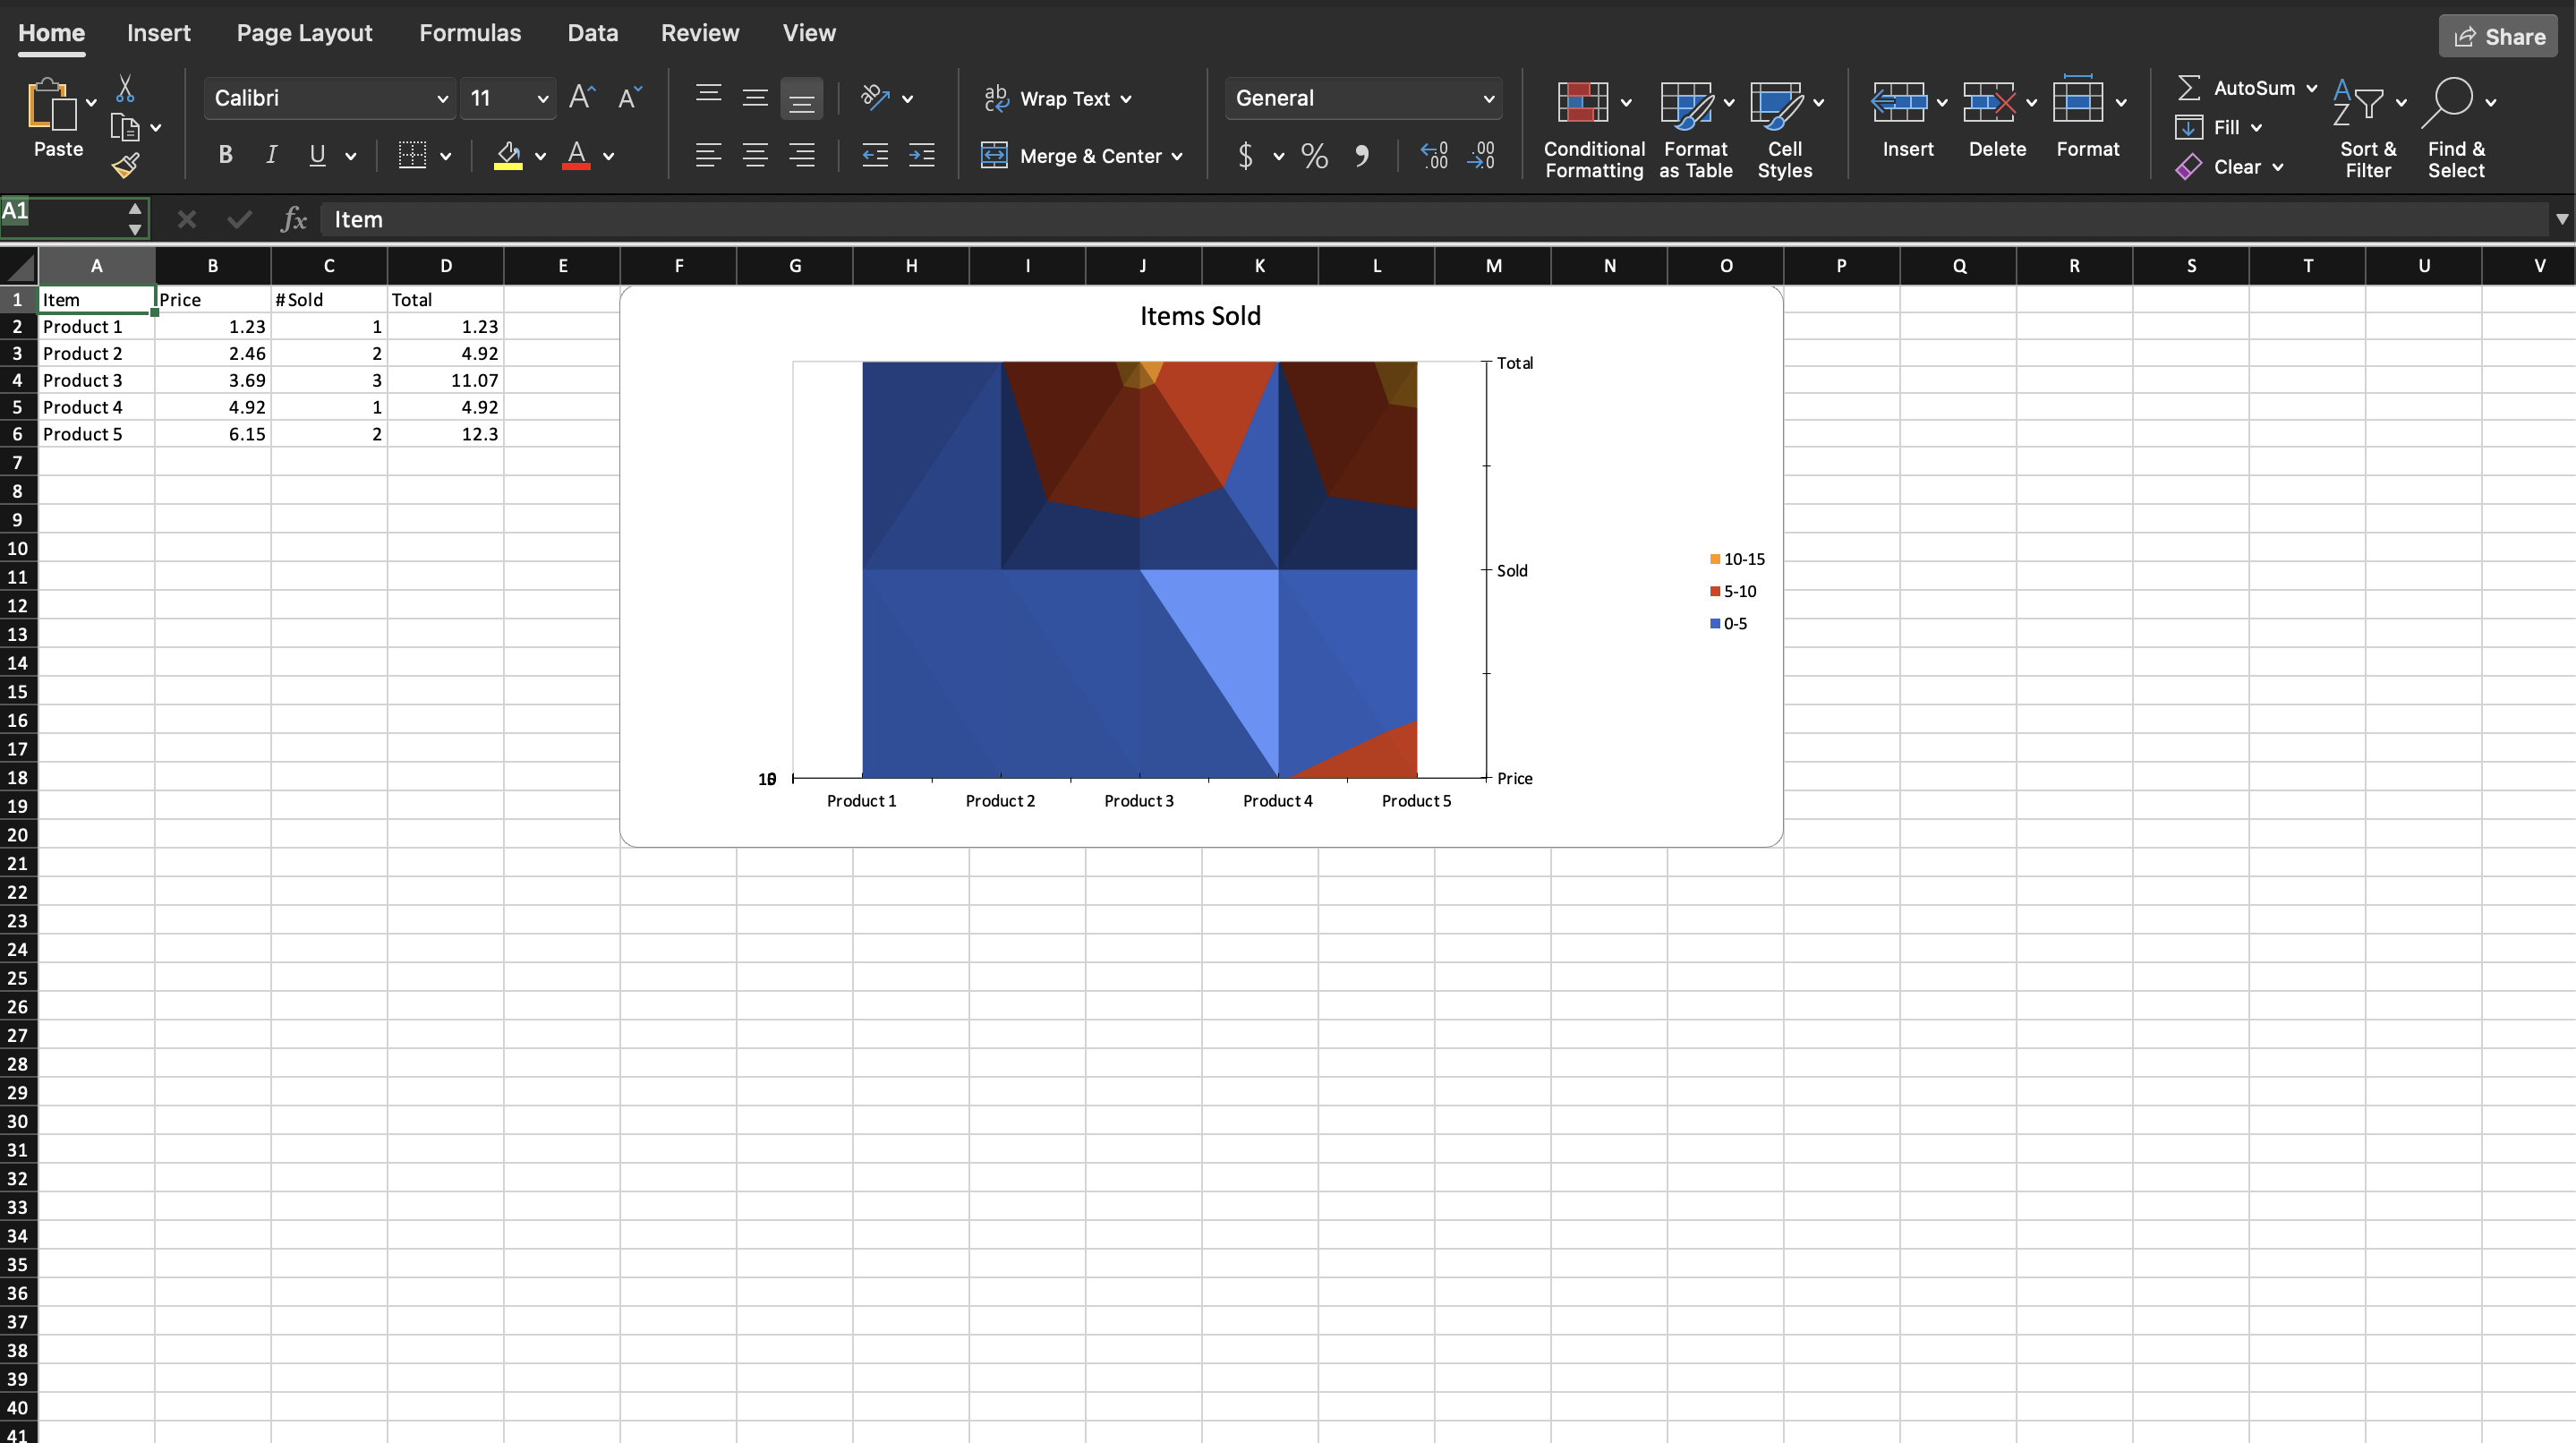
Surface Chart
A surface chart treats the series as a grid rather than as independent lines. Categories run along one edge, series along the other, and the value at each intersection becomes a height, colored by band. It is the chart for data that is genuinely two-dimensional: a measurement taken across a range of settings at a range of temperatures, or a cost that varies with two inputs at once.
One series gives you a ribbon, not a surface. Three or four is where the shape starts to read, and the series need to be in a meaningful order, because their sequence is the second dimension.
AddSurfaceChart produces the top-down view, which renders as colored contour
bands. AddSurface3DChart is the same data seen at an angle.
| Constructor | View |
|---|---|
AddSurfaceChart() | 3D chart rotated to look straight down: X rotation 90, Y rotation 0, perspective 0. |
AddSurface3DChart() | The default 3D view: X rotation 15, Y rotation 20. |
Adding the chart
dwng := ss.AddDrawing()
chart, anc := dwng.AddChart(spreadsheet.AnchorTypeTwoCell)
anc.SetWidthCells(10)

sc := chart.AddSurfaceChart()
priceSeries := sc.AddSeries()
priceSeries.SetText("Price")
priceSeries.CategoryAxis().SetLabelReference(`'Sheet 1'!A2:A6`)
priceSeries.Values().SetReference(`'Sheet 1'!B2:B6`)
Like any 3D plot, a surface needs three axes: category, value and series.
ca := chart.AddCategoryAxis()
va := chart.AddValueAxis()
sa := chart.AddSeriesAxis()
sc.AddAxis(ca)
sc.AddAxis(va)
sc.AddAxis(sa)

ca.SetCrosses(va)
va.SetCrosses(ca)
sa.SetCrosses(va)
SurfaceChartSeries is the same shape as a line series minus the extras: a
category source, a value source, SetText, and SetIndex/SetOrder for
position in the grid.
Limitations
The color bands are created up front. AddSurfaceChart builds fifteen band
formats and fills them from the standard palette, so a surface spanning more than
fifteen value bands reuses colors, and changing a band means editing
sc.X().BandFmts.
Wireframe rendering is off and has no setter. Turning it on is
sc.X().Wireframe.ValAttr = unioffice.Bool(true).
The view angle set by AddSurfaceChart is written to the chart, not the plot.
Calling AddSurfaceChart and then AddSurface3DChart on the same chart leaves
the second call’s angles in effect for both.
Run the example
The example reuses the standard product table, plotting price, quantity and total as three series of a surface.
git clone https://github.com/unidoc/unioffice-examples.git
cd unioffice-examples/spreadsheet/surface-chart
go run main.go
If this is your first time using UniOffice, follow the getting started guide to create an API key and set up your development environment.
View the full source
Sample output