Complex Spreadsheet
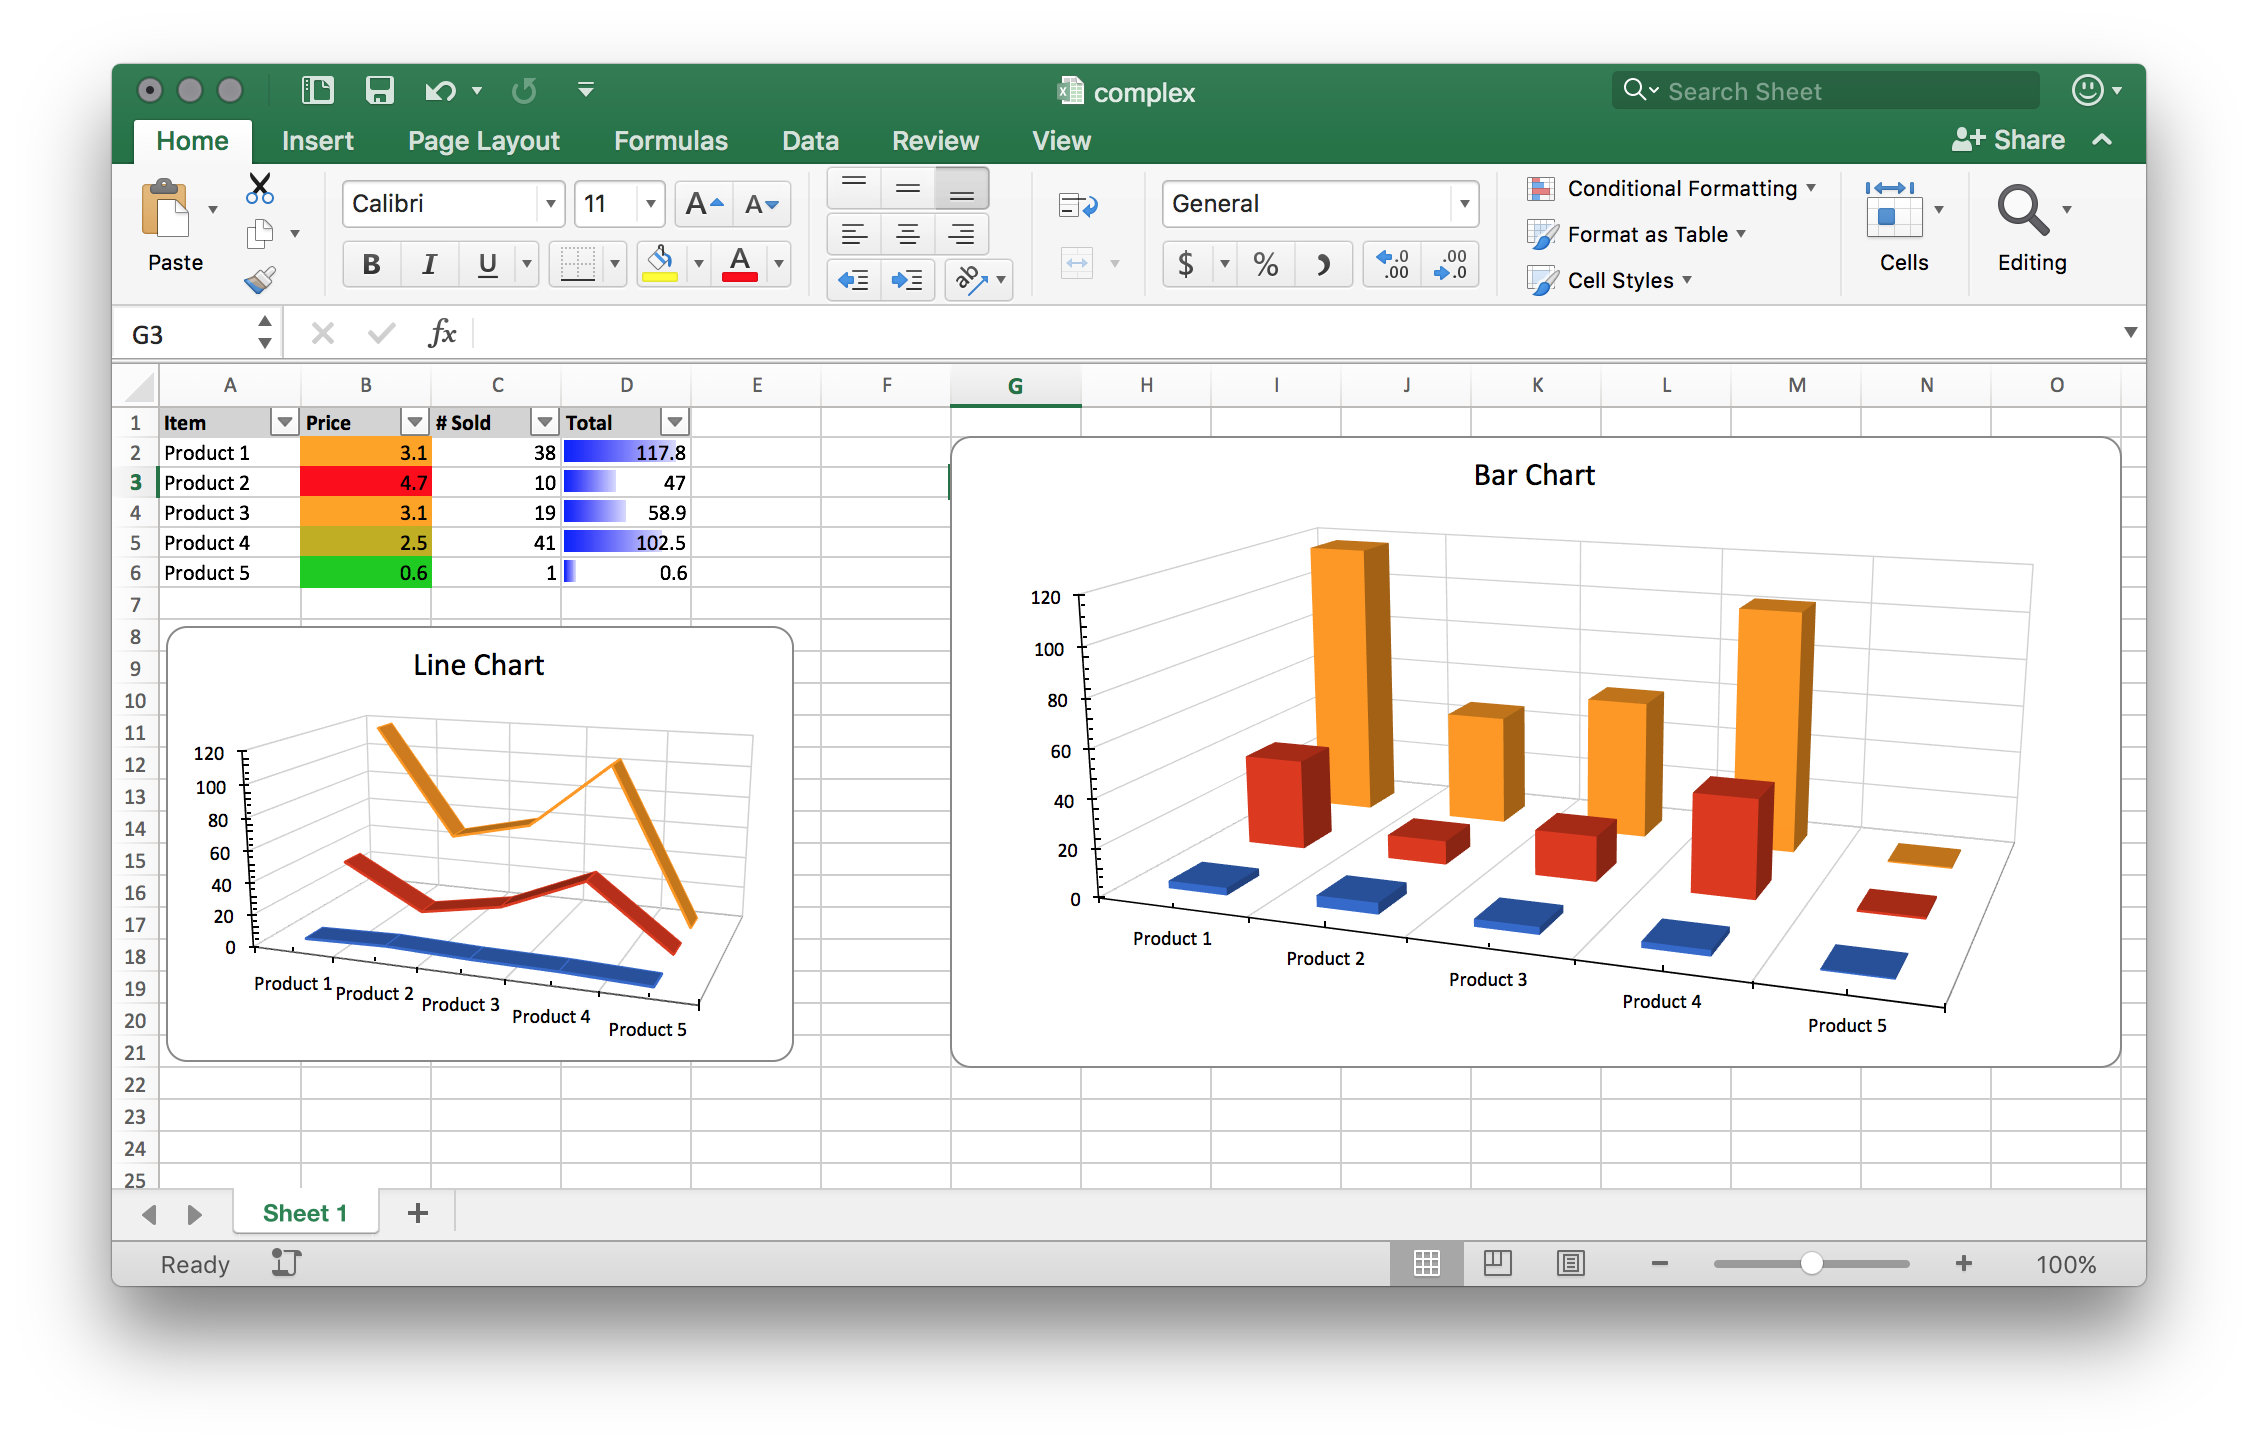
This is the page for seeing how the pieces fit together. Each feature it uses has a guide of its own; what the example adds is the order they go in and the places where two features have to agree with each other. It builds a product table with a styled header, a computed total column, conditional formatting on two of the columns, an auto-filter, and two charts driven from the same data.
Styles are shared, not per cell
The single biggest difference from a naive mental model is that formatting does not live on the cell. A cell holds an index into the workbook’s style sheet, and several cells pointing at the same style is the normal case rather than an optimization:
hdrStyle := ss.StyleSheet.AddCellStyle()

f := ss.StyleSheet.Fills().AddFill()
pf := f.SetPatternFill()
pf.SetFgColor(color.LightGray)
hdrStyle.SetFill(f)

fnt := ss.StyleSheet.AddFont()
fnt.SetBold(true)
hdrStyle.SetFont(fnt)

row.Cell("A").SetStyle(hdrStyle)
Fonts, fills and borders are separate collections on the style sheet, and a
CellStyle references them by index. SetFill, SetFont and SetStyle all
de-duplicate: each compares what you pass against what is already registered and
reuses the existing entry when they match, so building the same style twice is
harmless.
The flip side is that changing a style after it has been applied changes every
cell using it. If you want one header cell different from the others, build a
second CellStyle.
A style is only written into the file once something applies it. AddCellStyle
hands back an unregistered style, and it is Cell.SetStyle that puts it in the
cell formats table. A style you create and never apply does not appear in the
output.
Cross-references have to line up
Three things in the example reference cell ranges as strings, and none of them is checked against the data:
sheet.SetAutoFilter("A1:D6")covers the header row plus five data rows.sheet.AddConditionalFormatting([]string{"D2:D6"})covers the data rows only.- The chart series read
'Sheet 1'!B2:B6and friends.
The sheet name in those chart references is the default AddSheet produced,
which contains a space, hence the quoting. Rename the sheet and the chart
references go stale without any error. The same is true of the SetFormulaRaw
calls building the total column: C%d*B%d is a string, and the row arithmetic
that produces it is yours to get right.
Charts live on a drawing
A sheet has one drawing, and every chart and image on the sheet goes on it:
dwng := ss.AddDrawing()
chrt1, anc1 := dwng.AddChart(spreadsheet.AnchorTypeTwoCell)
chrt2, anc2 := dwng.AddChart(spreadsheet.AnchorTypeTwoCell)
anc1.SetWidth(9)
anc1.MoveTo(6, 1)
anc2.MoveTo(0, 9)
sheet.SetDrawing(dwng)
AddChart returns the chart and its anchor together. The anchor positions it;
the chart gets its series, axes and title. Note that SetWidth on a two-cell
anchor is a no-op, so the anc1.SetWidth(9) in the example does nothing and the
chart takes its size from the cell range the anchor spans. See
Insert Images for the full anchor comparison, and
Charts for the chart types.
Axes are added to the chart and then attached to the series holder, and the two have to cross each other explicitly:
ca := chrt.AddCategoryAxis()
va := chrt.AddValueAxis()
lc.AddAxis(ca)
lc.AddAxis(va)
ca.SetCrosses(va)
va.SetCrosses(ca)
A 3D line chart wants a third axis, which is what lc.AddAxis(chart.NullAxis)
supplies in addLineChart. A 3D bar chart does not.
Limitations
Conditional formatting rules are evaluated by Excel, not by unioffice. The data bar and color scale in the example produce no output of their own; they are instructions that only mean something once the file is opened.
SetFormulaRaw stores the formula text without a cached result, so the total
column is blank until Excel calculates it. Workbook.RecalculateFormulas will
compute and cache the values if you need them present in the file itself.
Nothing validates a range string. A typo in a conditional formatting range, an auto-filter range or a chart series reference produces a file that opens with the feature quietly missing or misplaced.
Run the example
The example is one main plus two chart builders, addBar3DChart and
addLineChart. Read main for the sheet construction and the two helpers for
how a chart’s series and axes are assembled.
git clone https://github.com/unidoc/unioffice-examples.git
cd unioffice-examples/spreadsheet/complex
go run main.go
If this is your first time using UniOffice, follow the getting started guide to create an API key and set up your development environment.
View the full source
Sample output